![]()
![]()
![]()
![]()
![]()
![]()


![]()
![]()
![]()
AAInfographics 是 AAChartKit 的 Swift 语言版本。AAChartKit是基于流行的开源前端图表库 Highcharts 构建的一套易于使用、极其优雅的面向对象的图形绘制控件。它可以非常快速地将交互式图表添加到您的移动项目中。它支持单点触摸拖动进行数据检查,多点触摸进行缩放,以及对您的应用程序的高级响应能力。
-
🎂 环境友好。支持
iOS、iPadOS和macOS。完全支持Swift语言,并且有更多类型版本,例如Objective-C语言版本 AAChartKit、Java语言版本 AAChartCore、Kotlin语言版本 AAInfographics 。要获取更多详细信息,您可以查看 源代码链接列表。 -
🚀 强大且易于使用。它支持
柱状图、条形图、面积图、面积样条图、折线图、样条图、雷达图、极地图、饼图、气泡图、金字塔图、漏斗图、柱状范围图、面积范围图、混合图和其他图形。 计划支持更多图表类型。 -
📝 现代声明式语法。与以前的命令式编程技术不同,在 AAChartKit 中绘制任何自定义图表时,您无需关心令人烦恼且乏味的内部实现细节。描述你想要的,你就会得到你所描述的。
-
🎮 互动和动画。图表
动画效果精致、细腻、流畅、美观。 -
⛓ 链式编程。 支持像 SwiftUI 和 Jetpack Compose 这样的
链式编程语法。 -
🦋 极简主义。
AAChartView + AAChartModel = Chart。 AAInfographics 遵循一个极简主义公式:图表视图 + 图表模型 = 你想要的图表,就像强大而美丽的图表框架 AAChartKit 一样。 -
🖱 交互事件回调。 支持监控 用户点击事件和单指移动事件,可用于实现双图联动,甚至多图联动,以及其他更复杂的自定义用户交互效果。
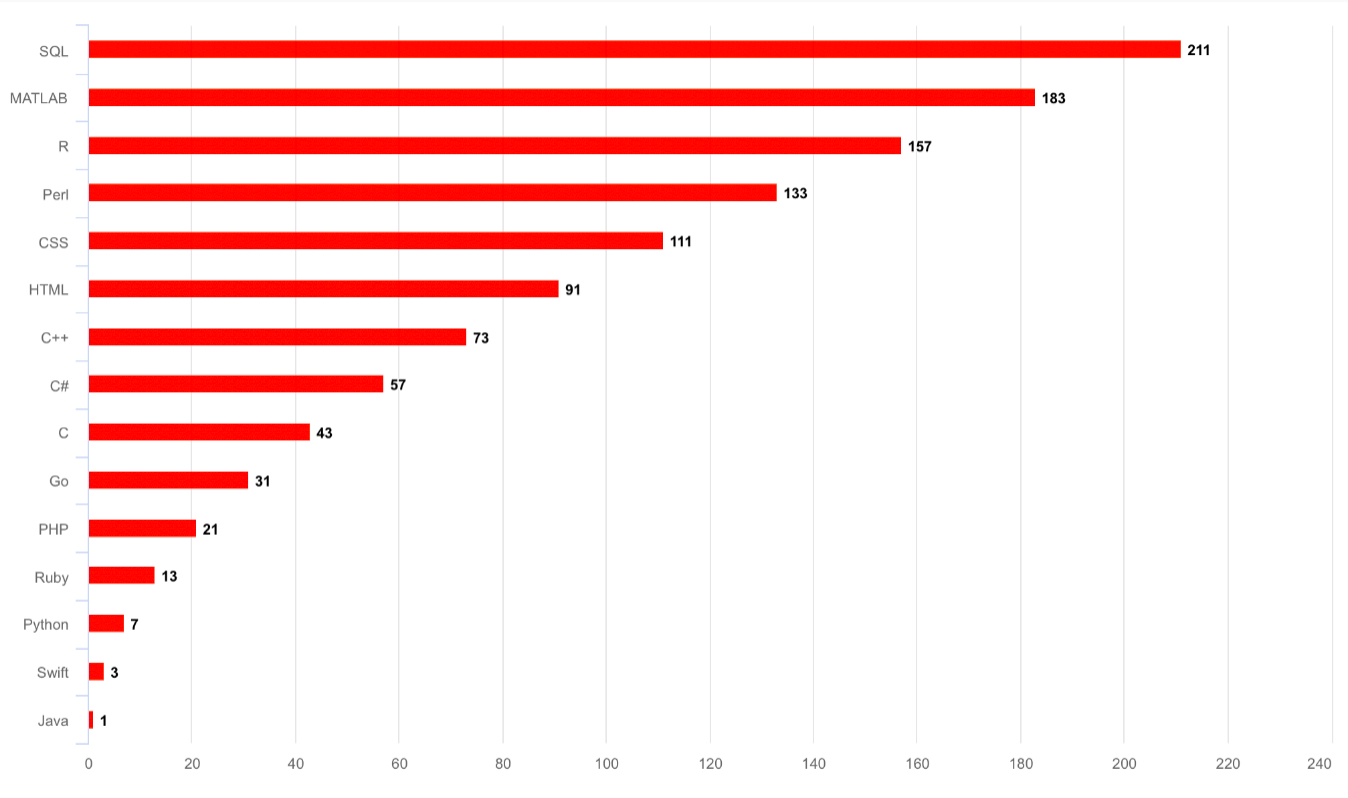
| 柱状图 | 柱状范围图 | 面积图 |
|---|---|---|
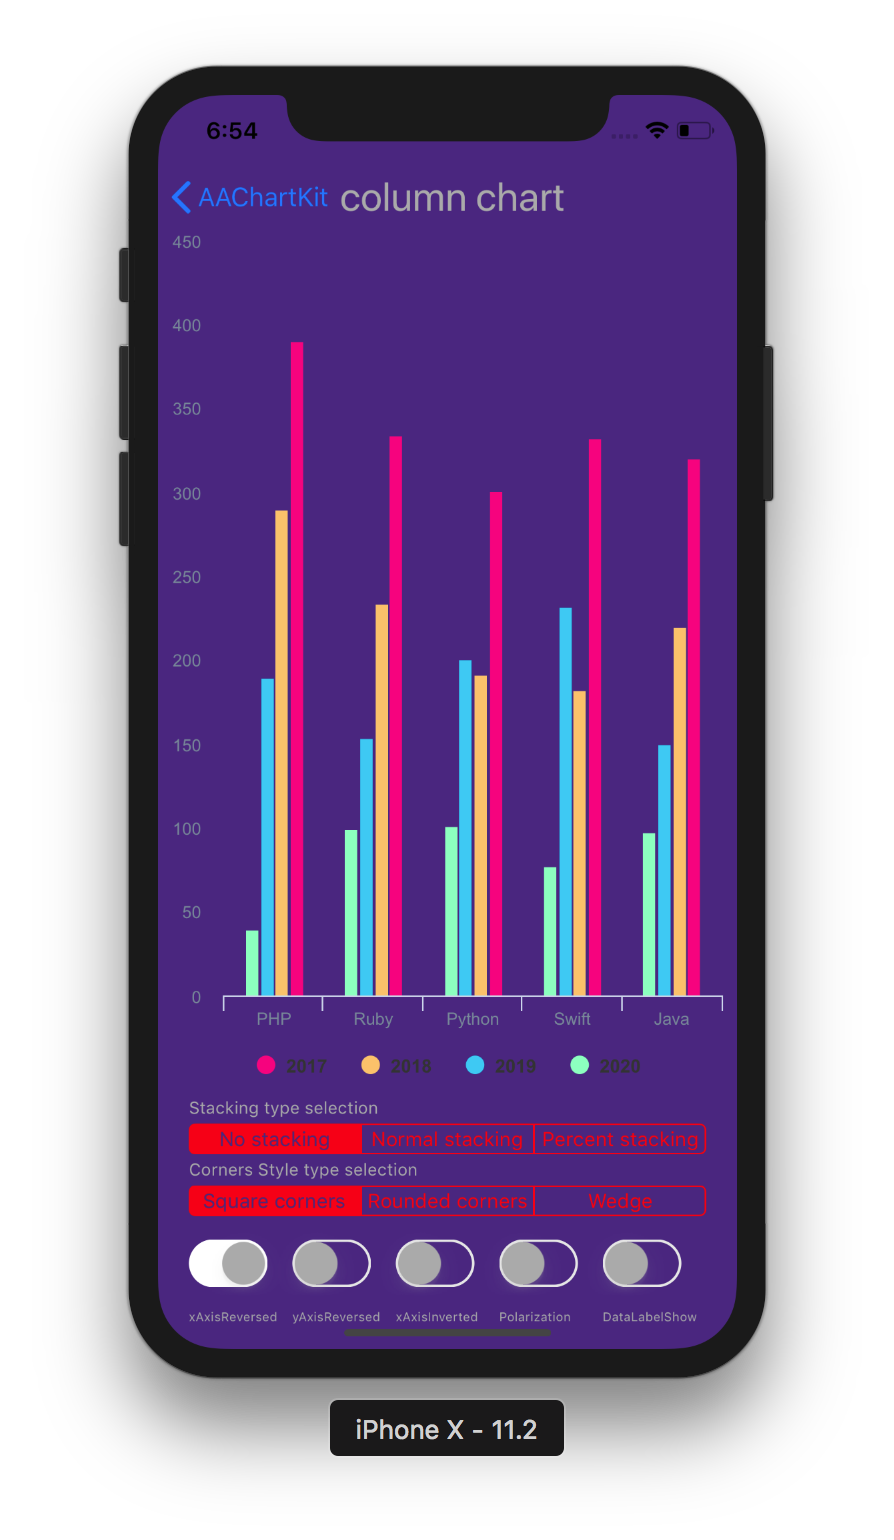 |
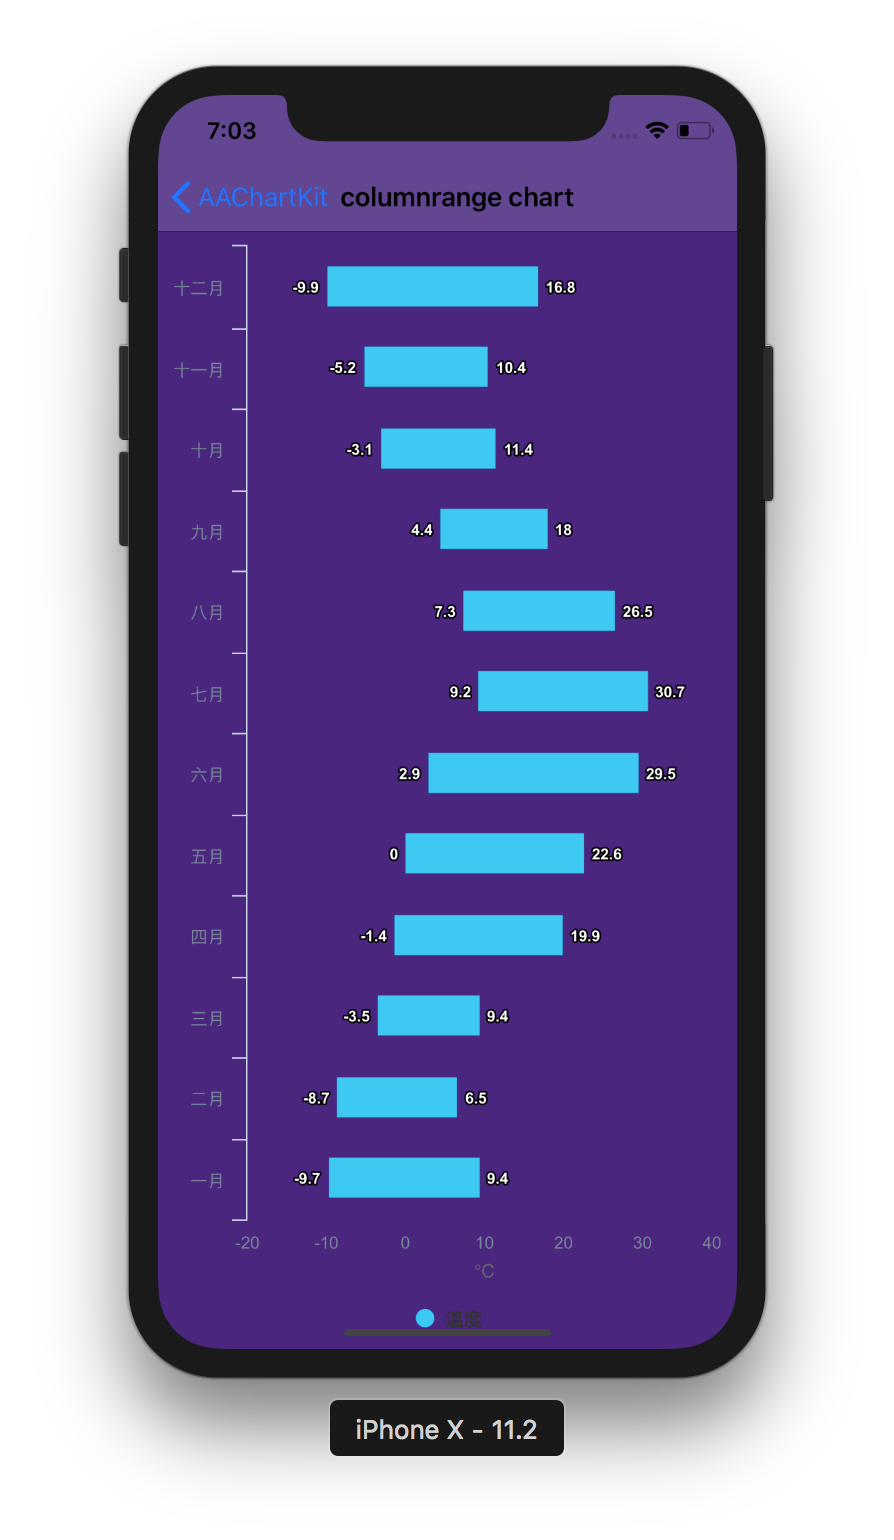 |
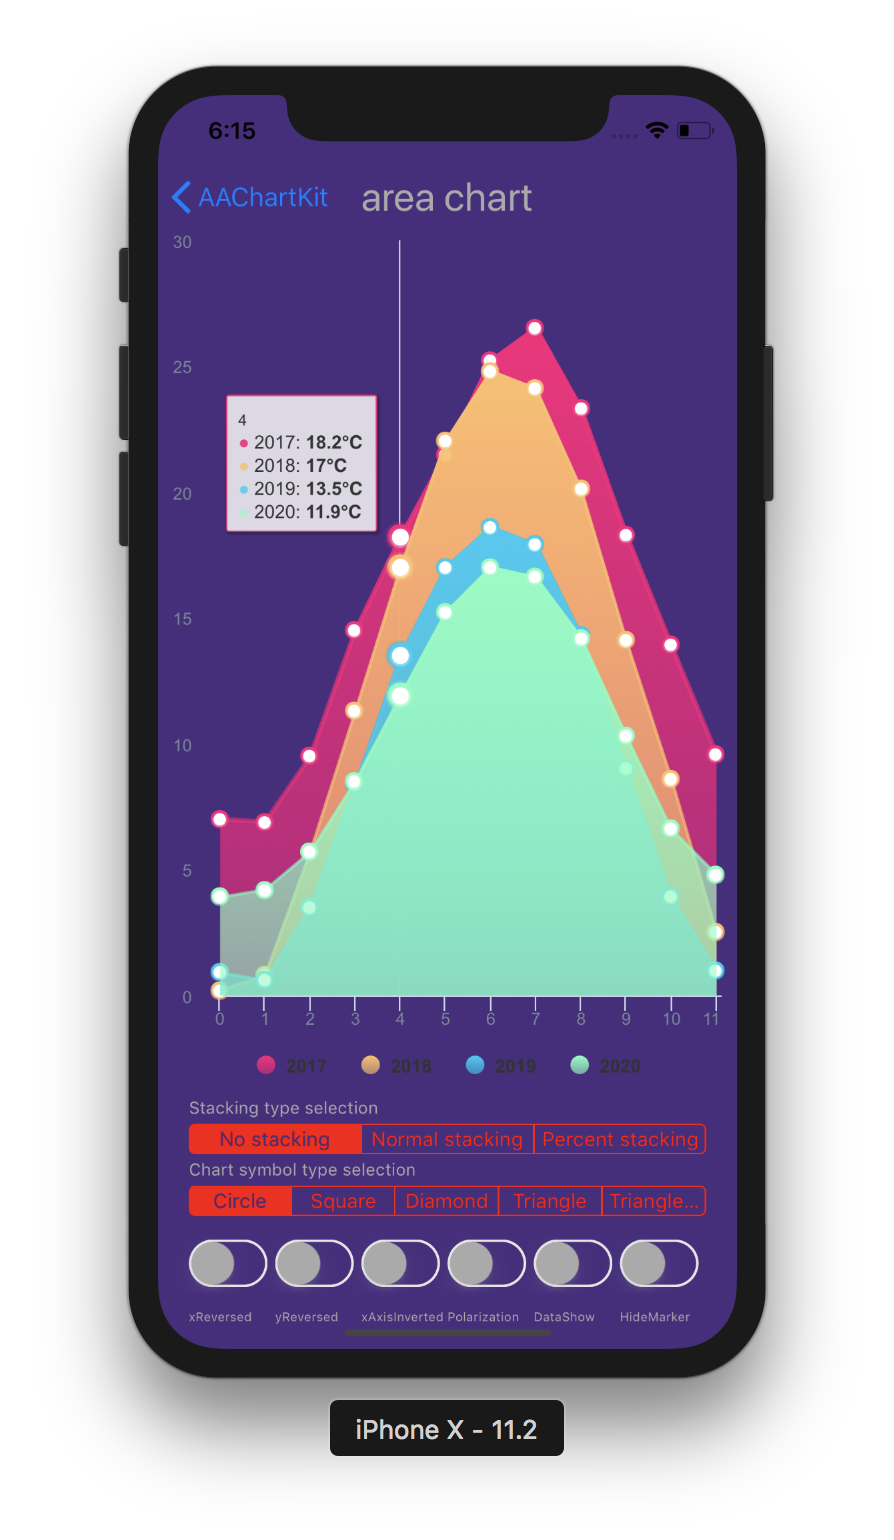 |
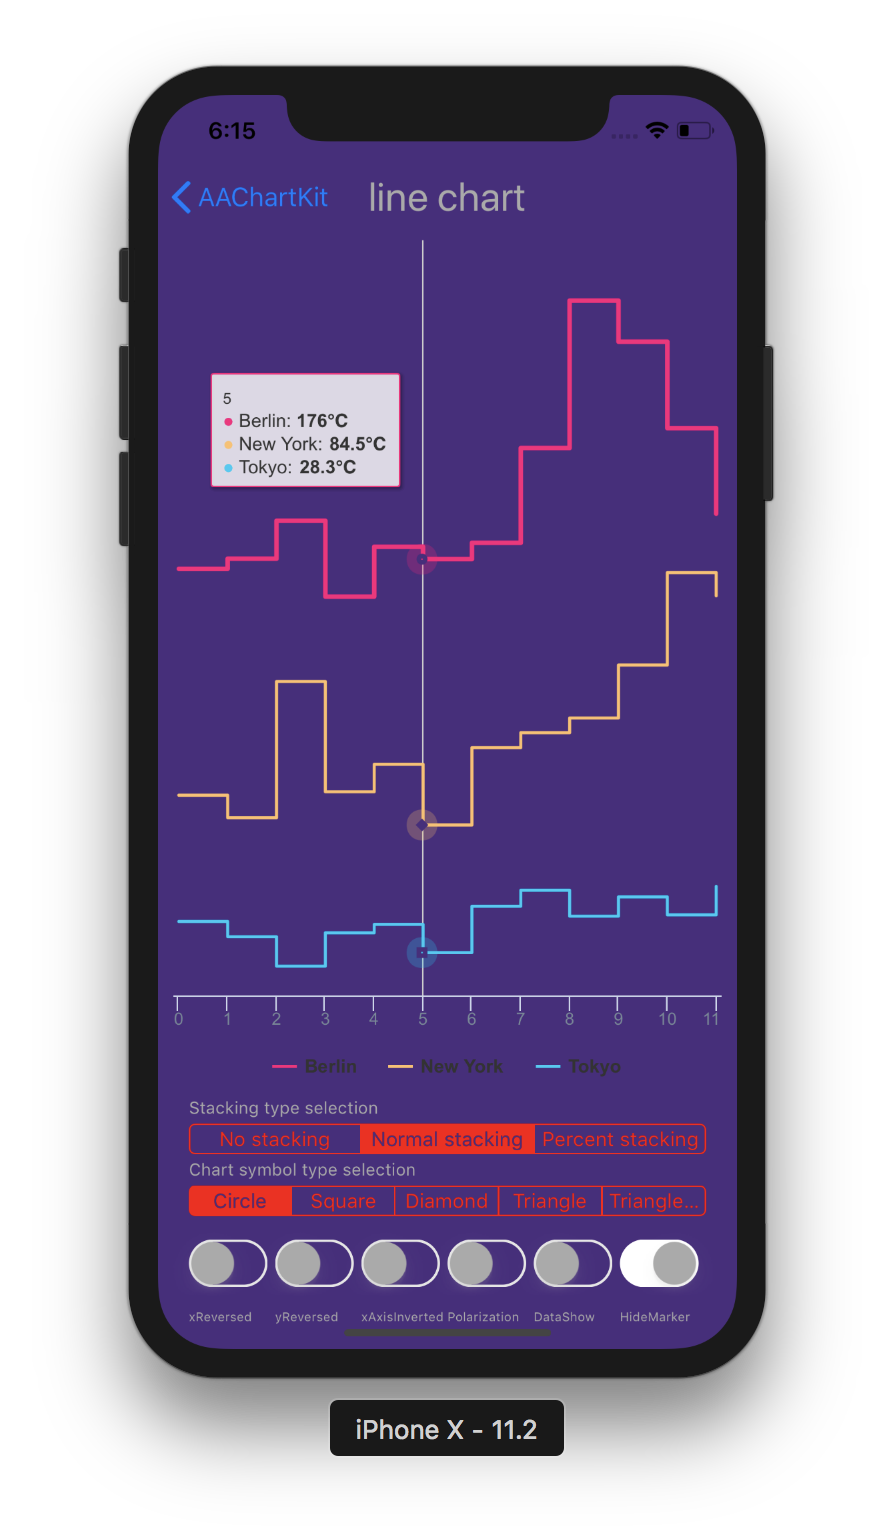
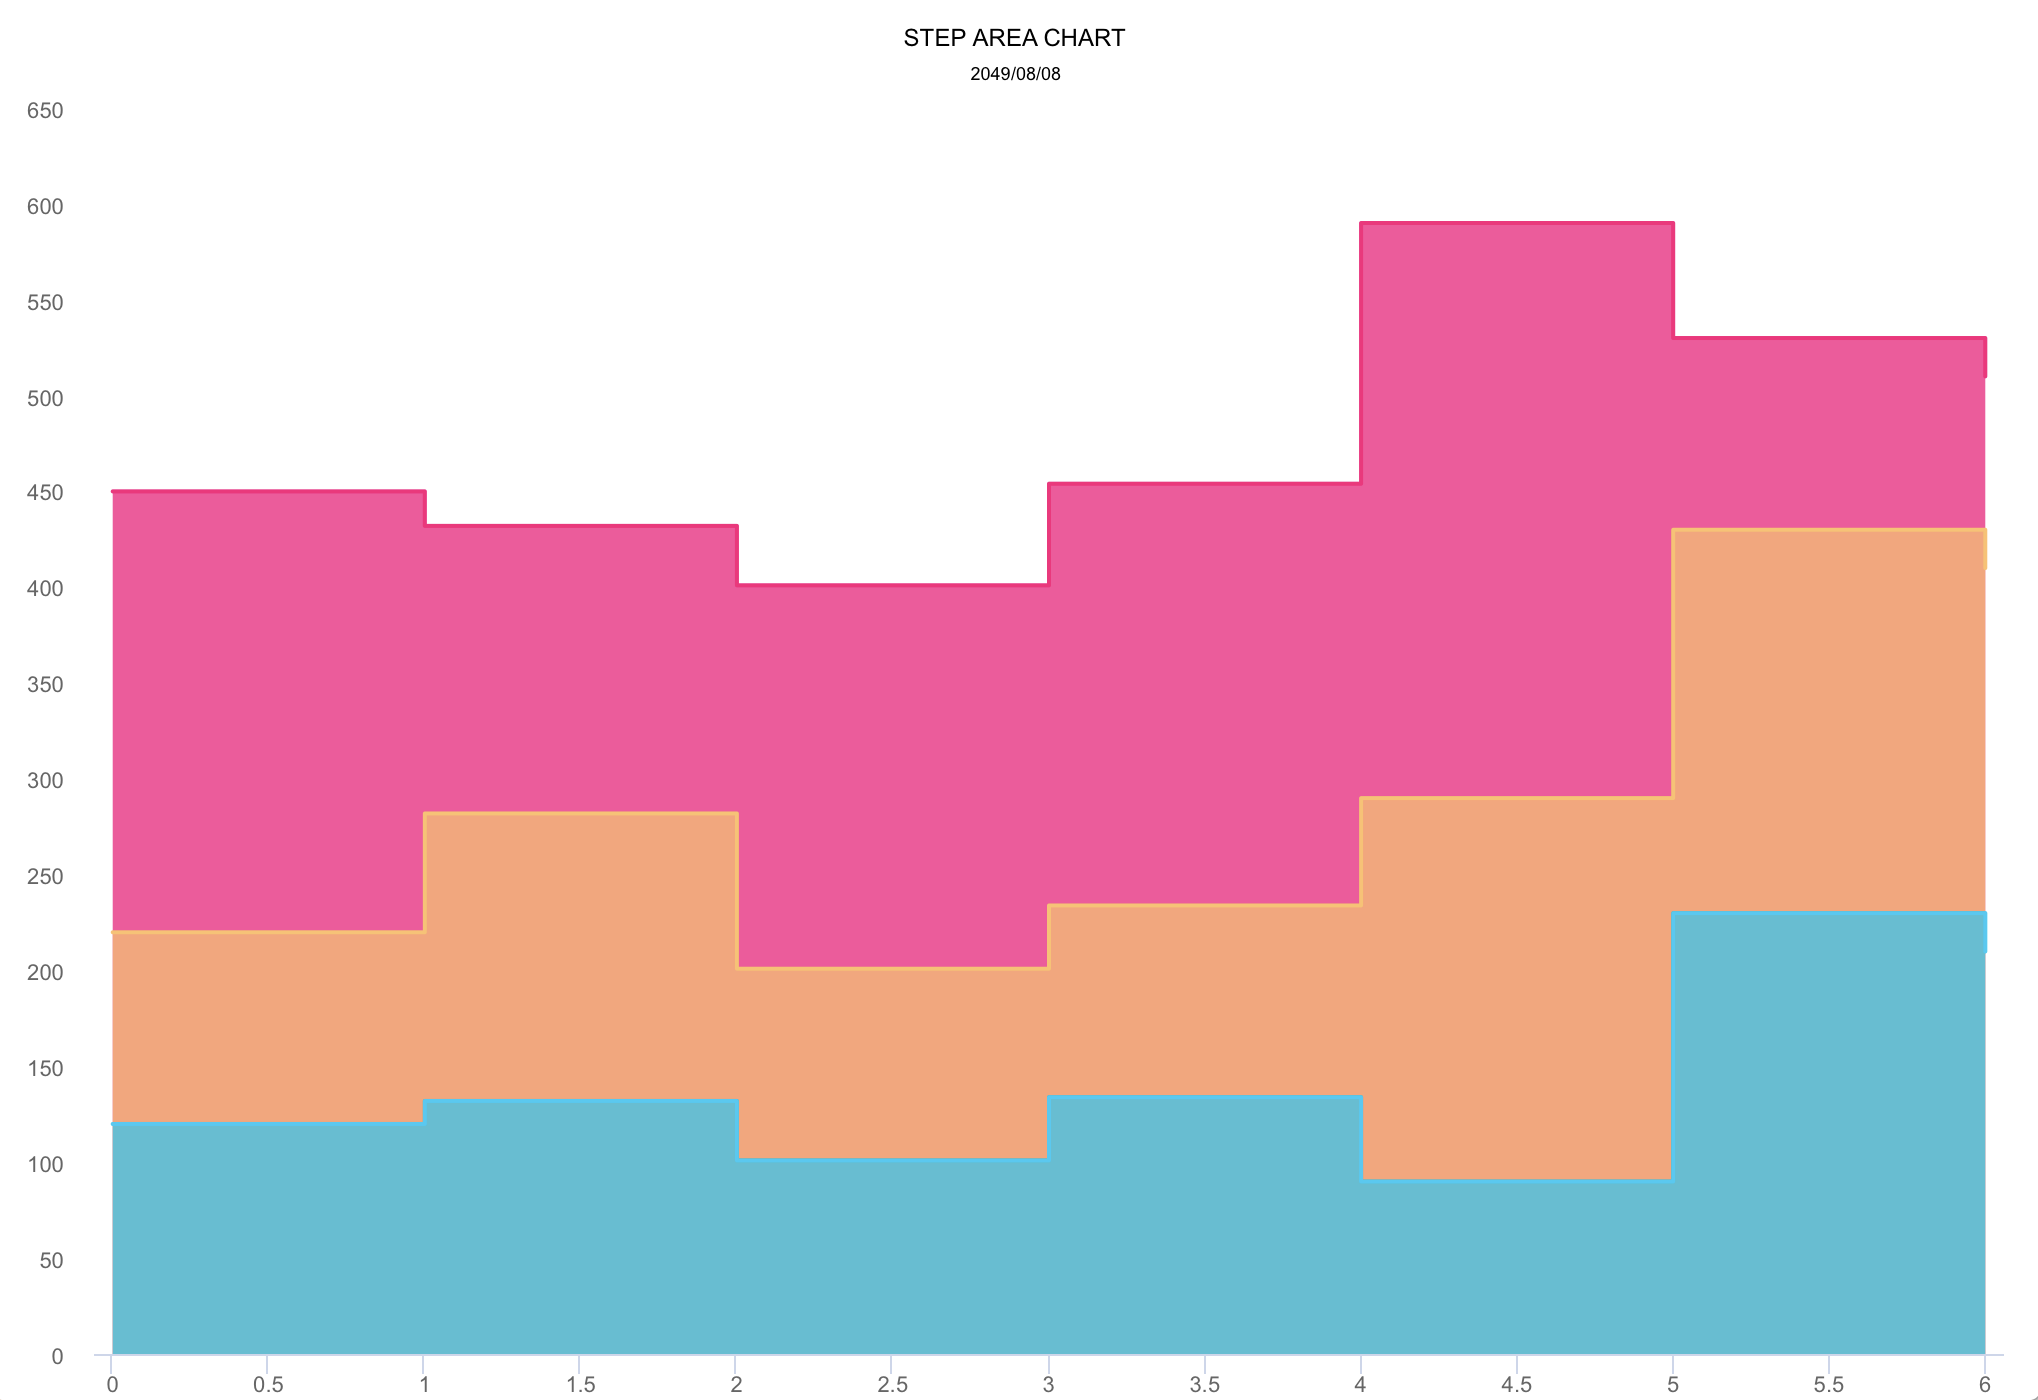
| 折线图 | 阶梯面积图 | 阶梯折线图 |
|---|---|---|
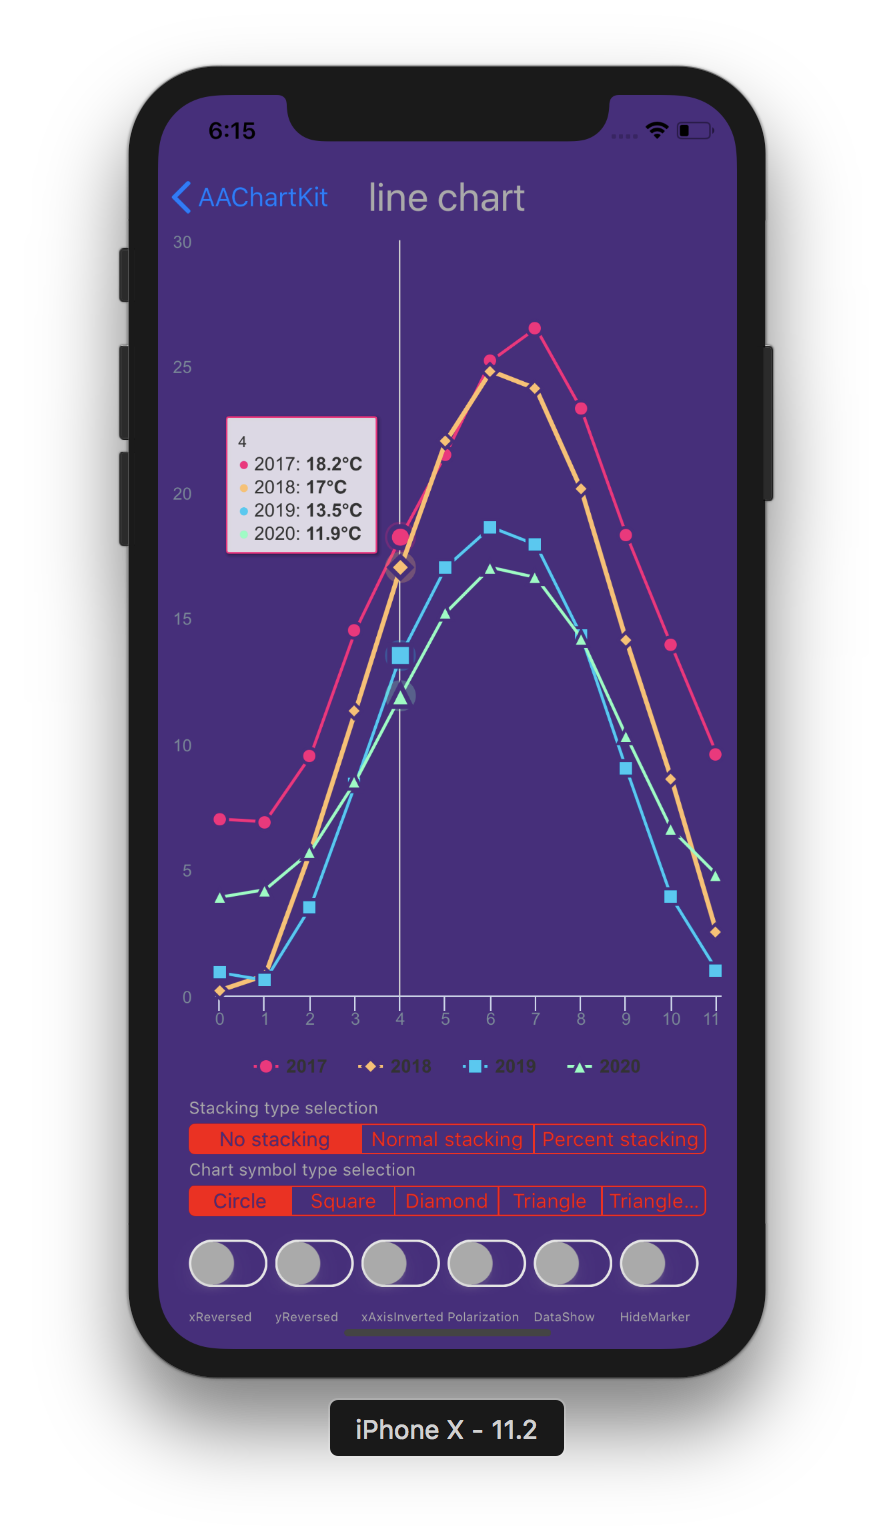 |
 |
 |
| 样条图 | 面积样条图 | 堆叠极地图 |
|---|---|---|
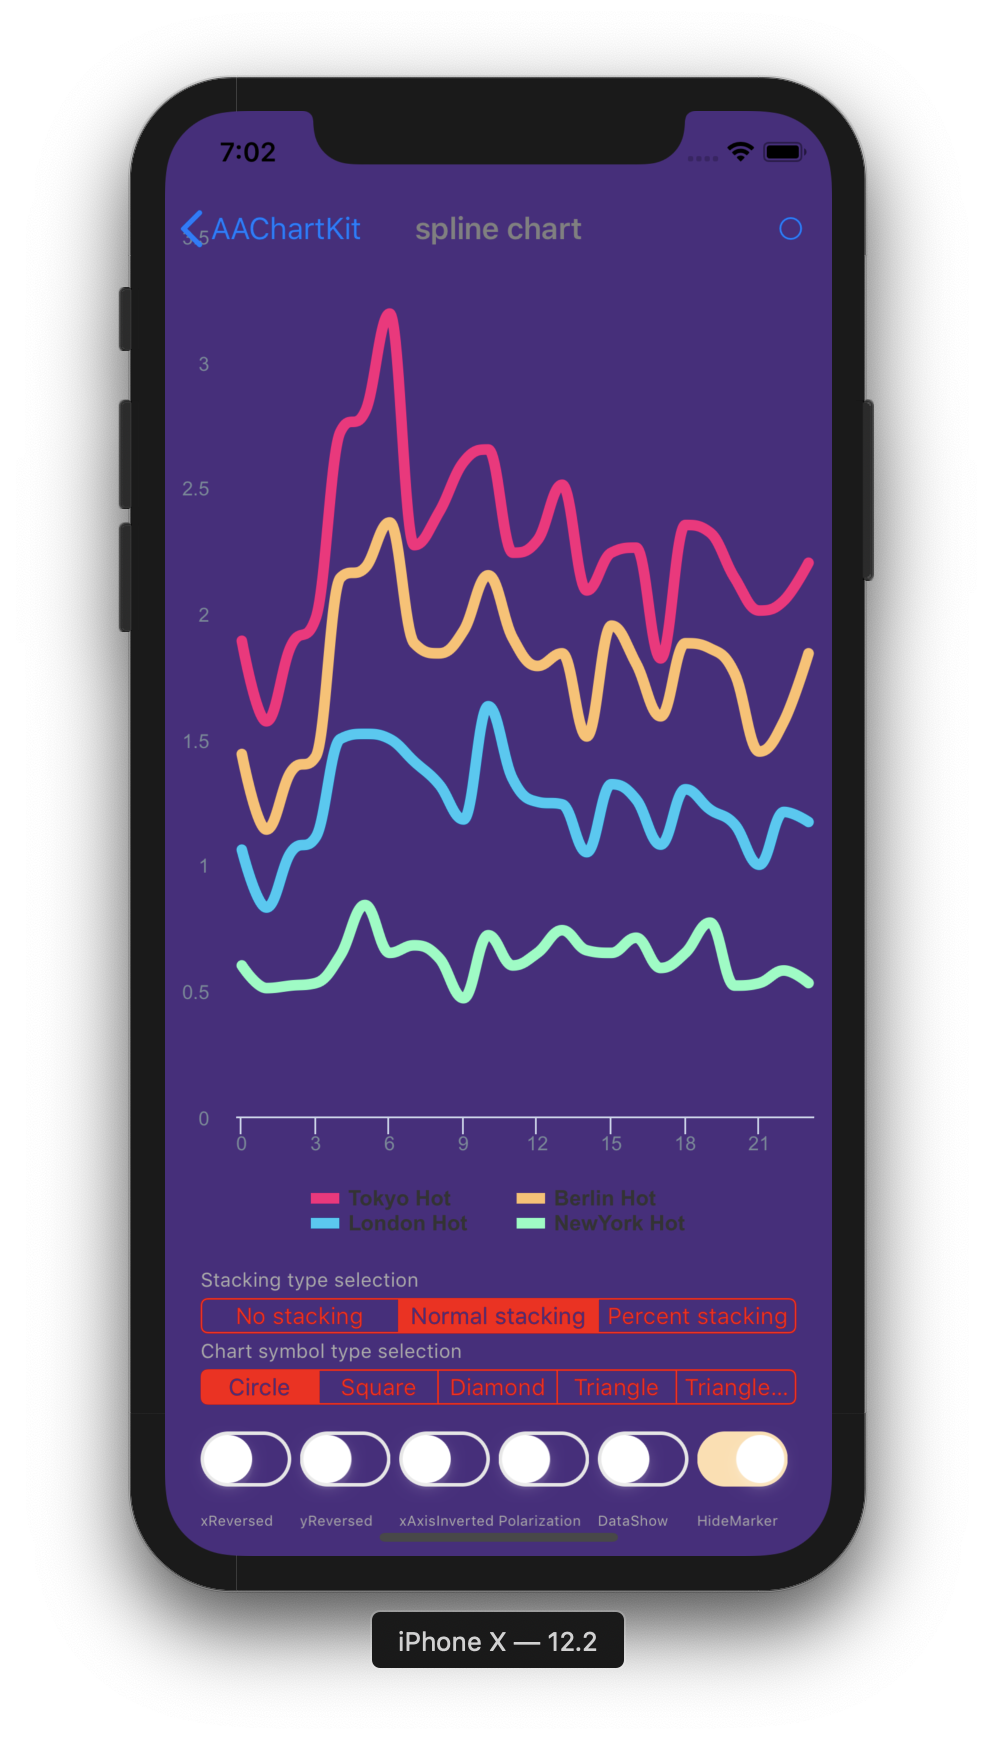 |
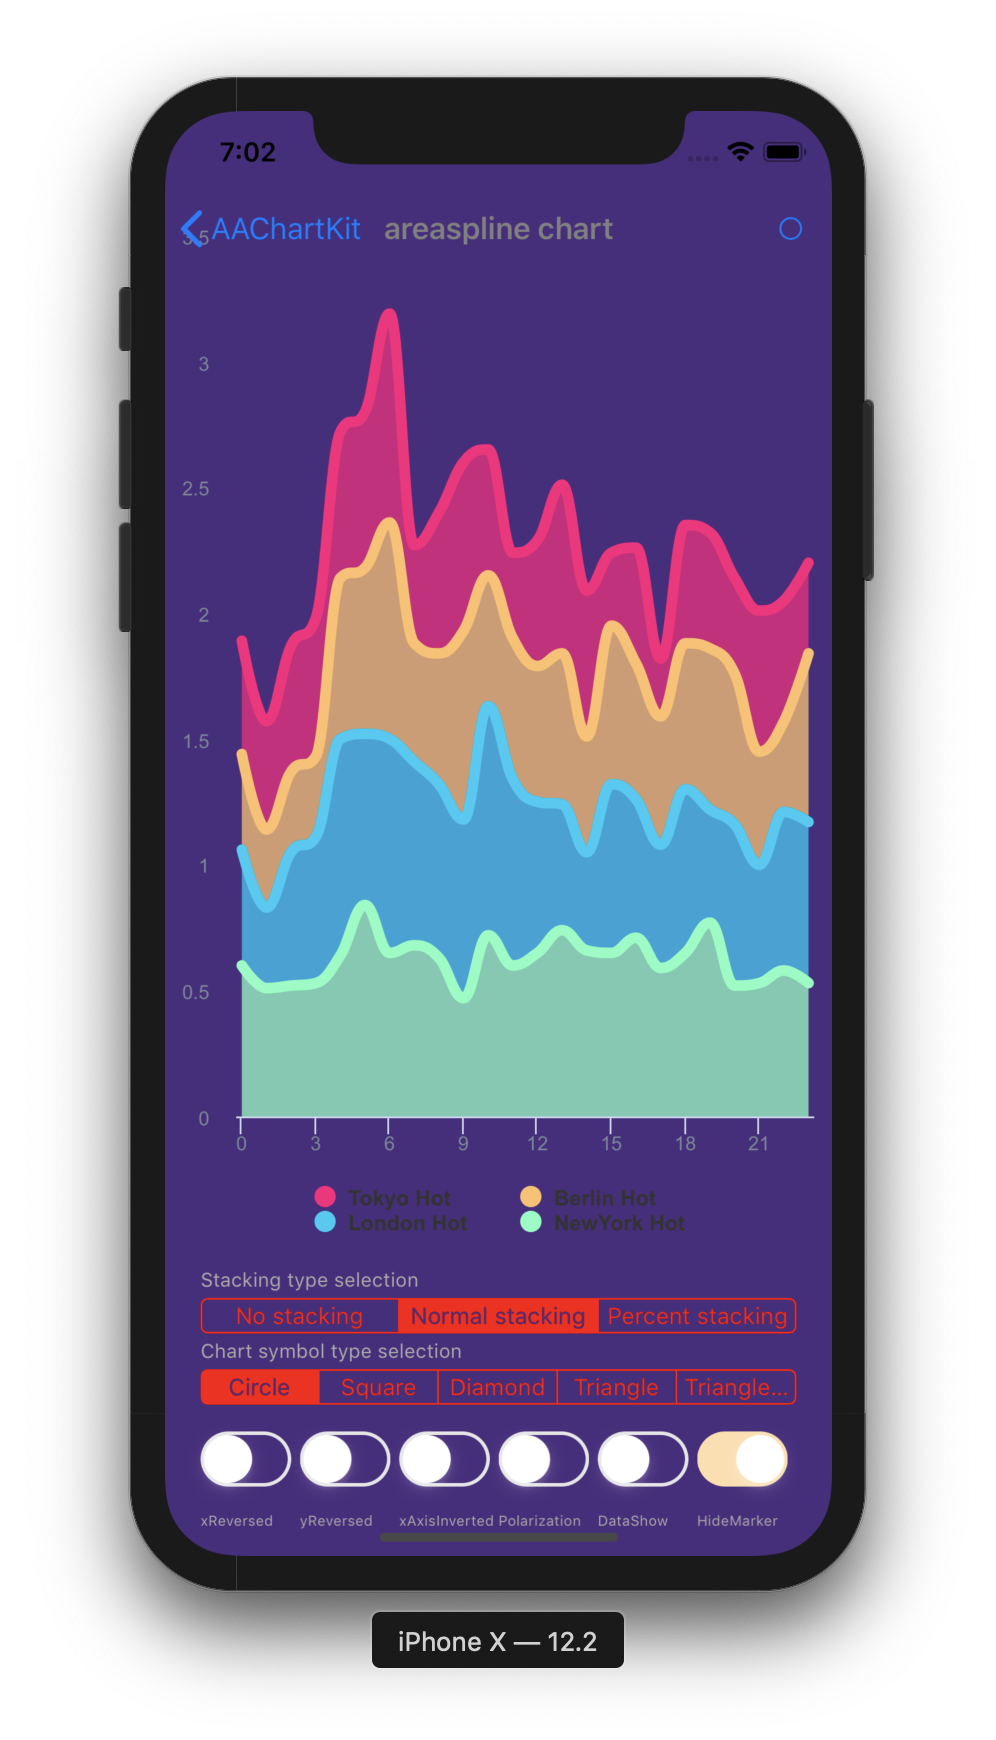 |
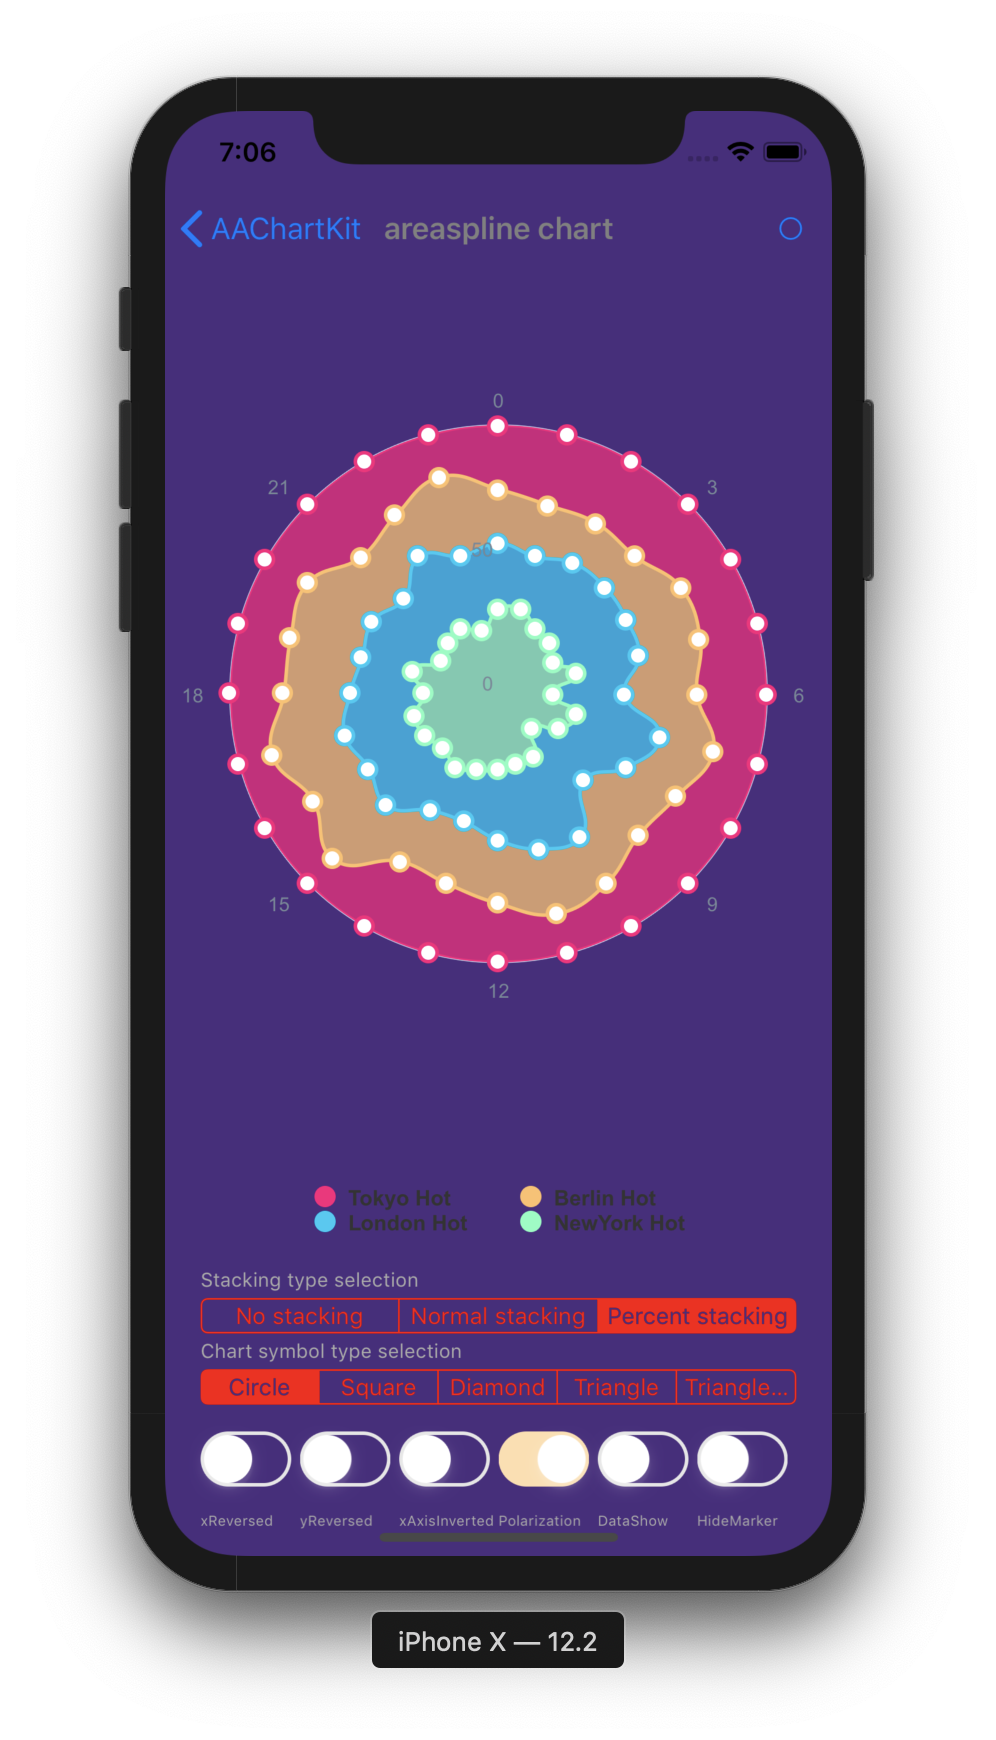 |
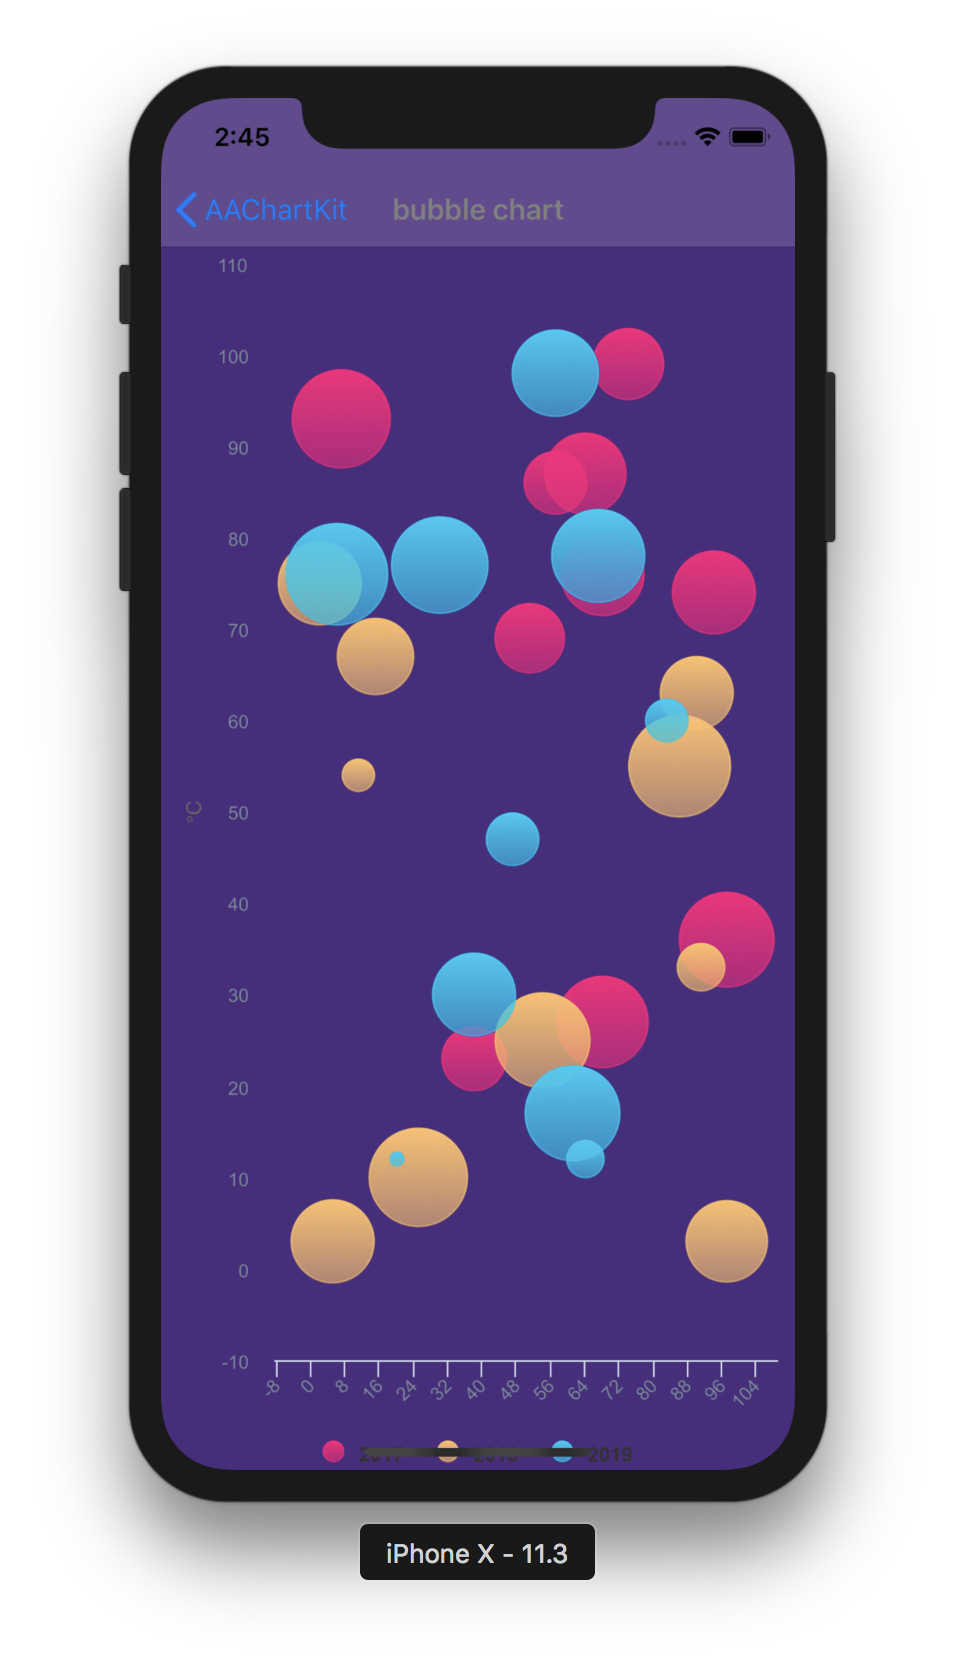
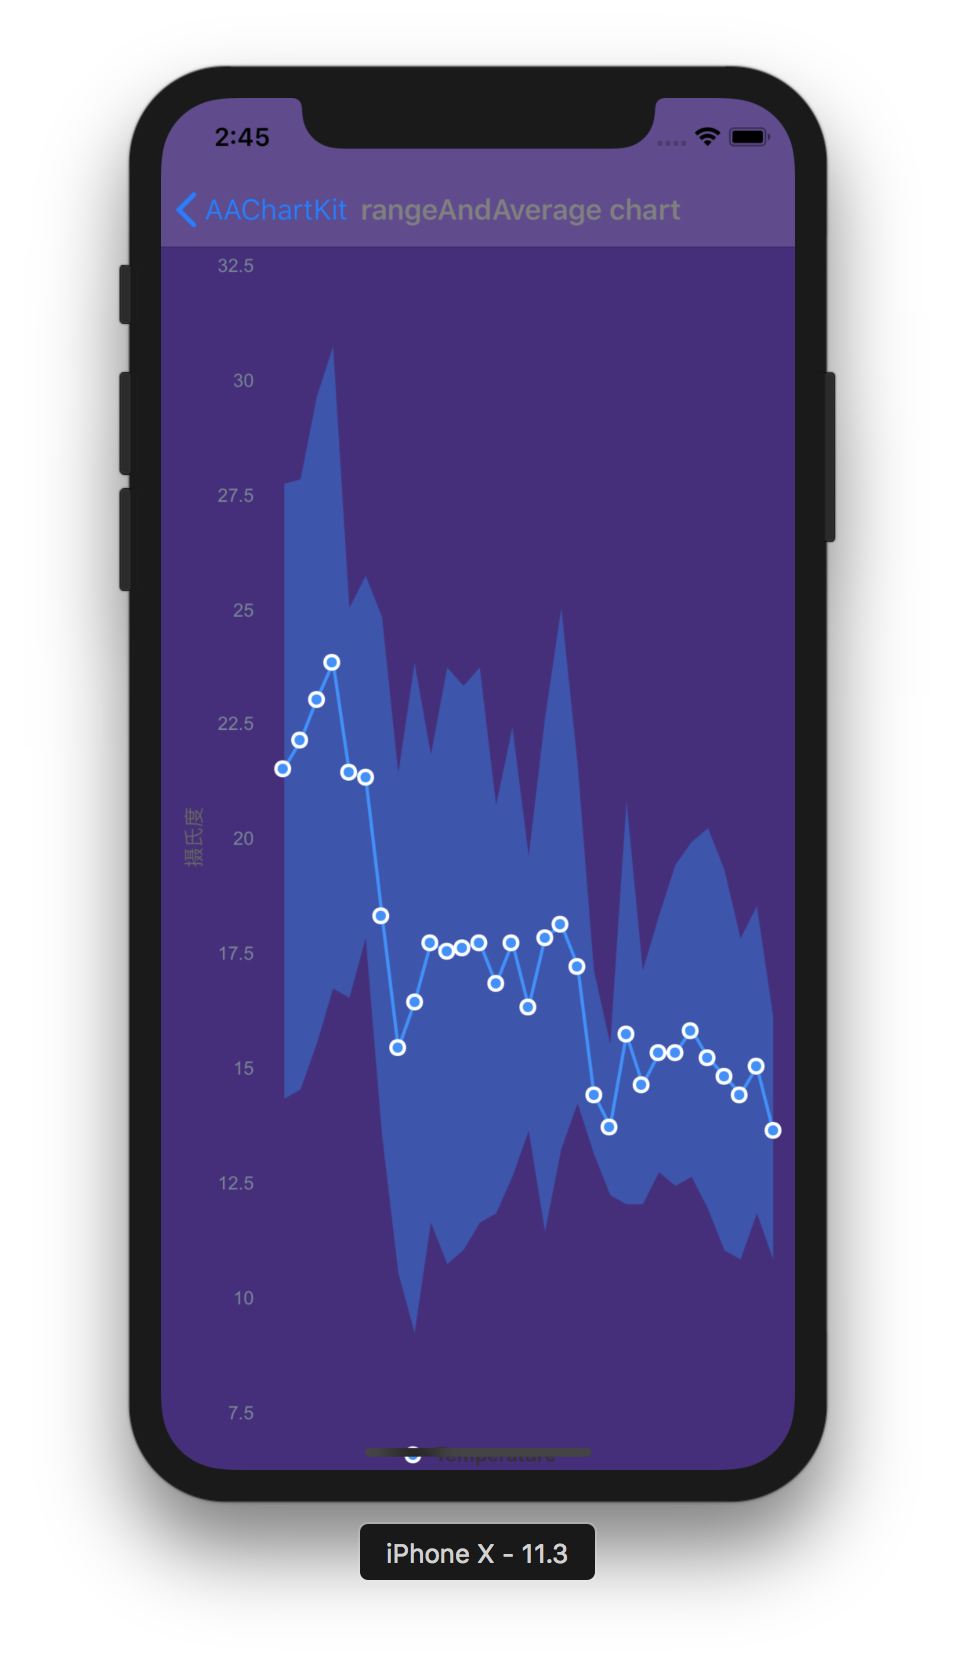
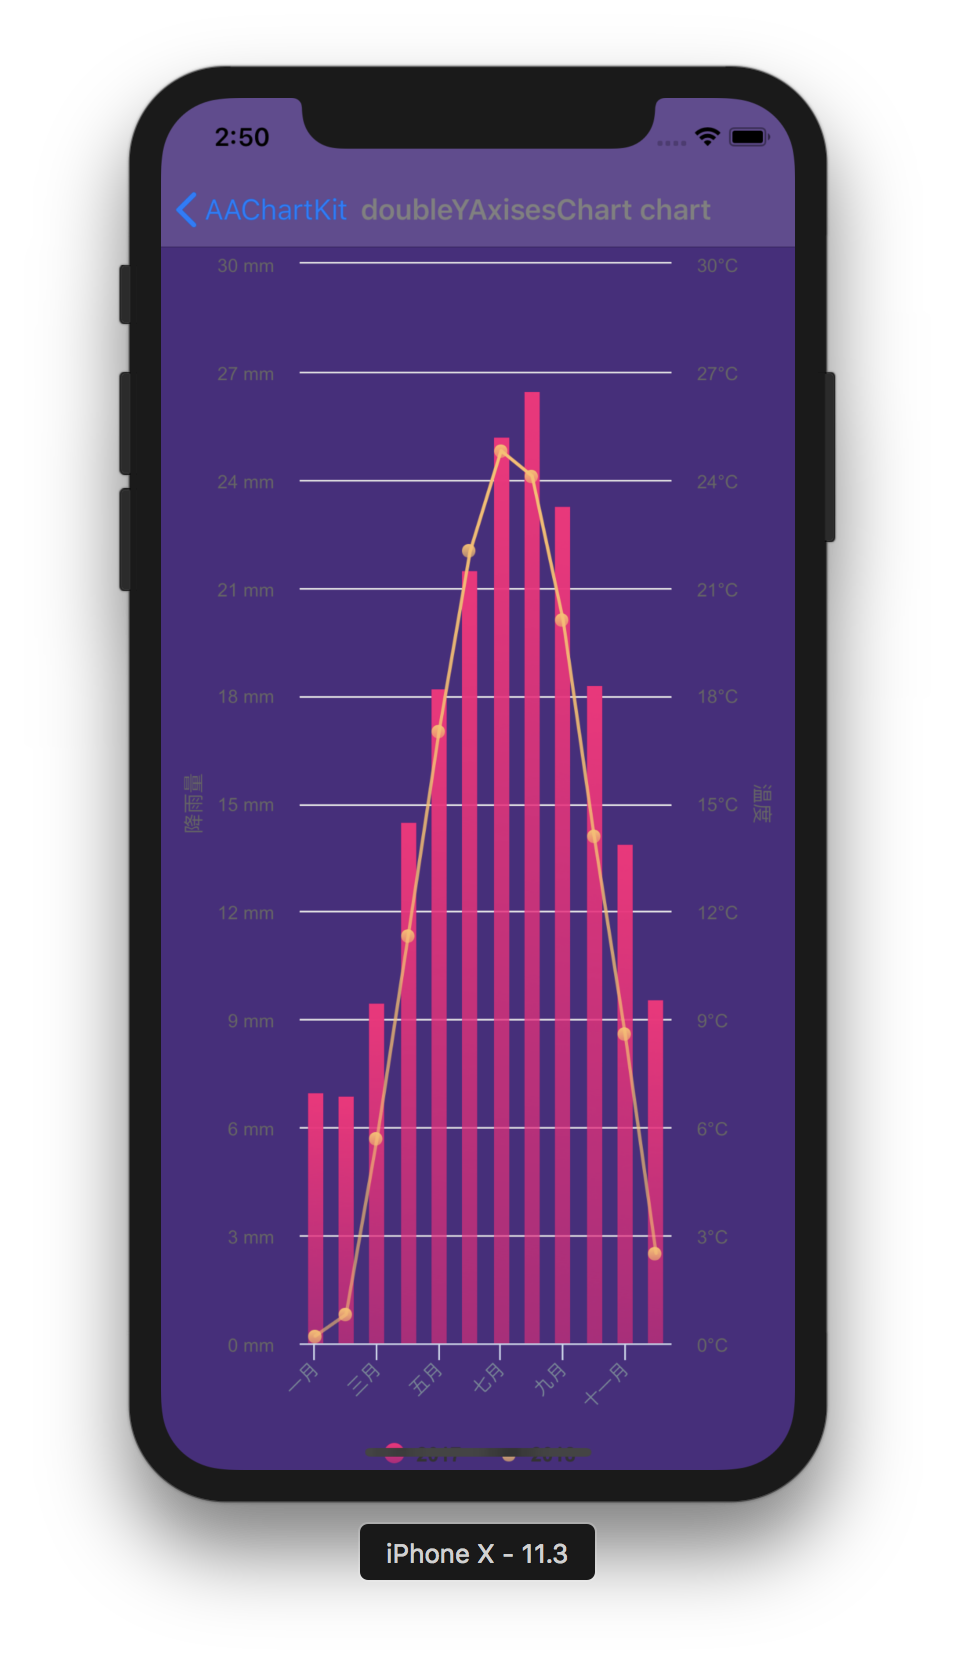
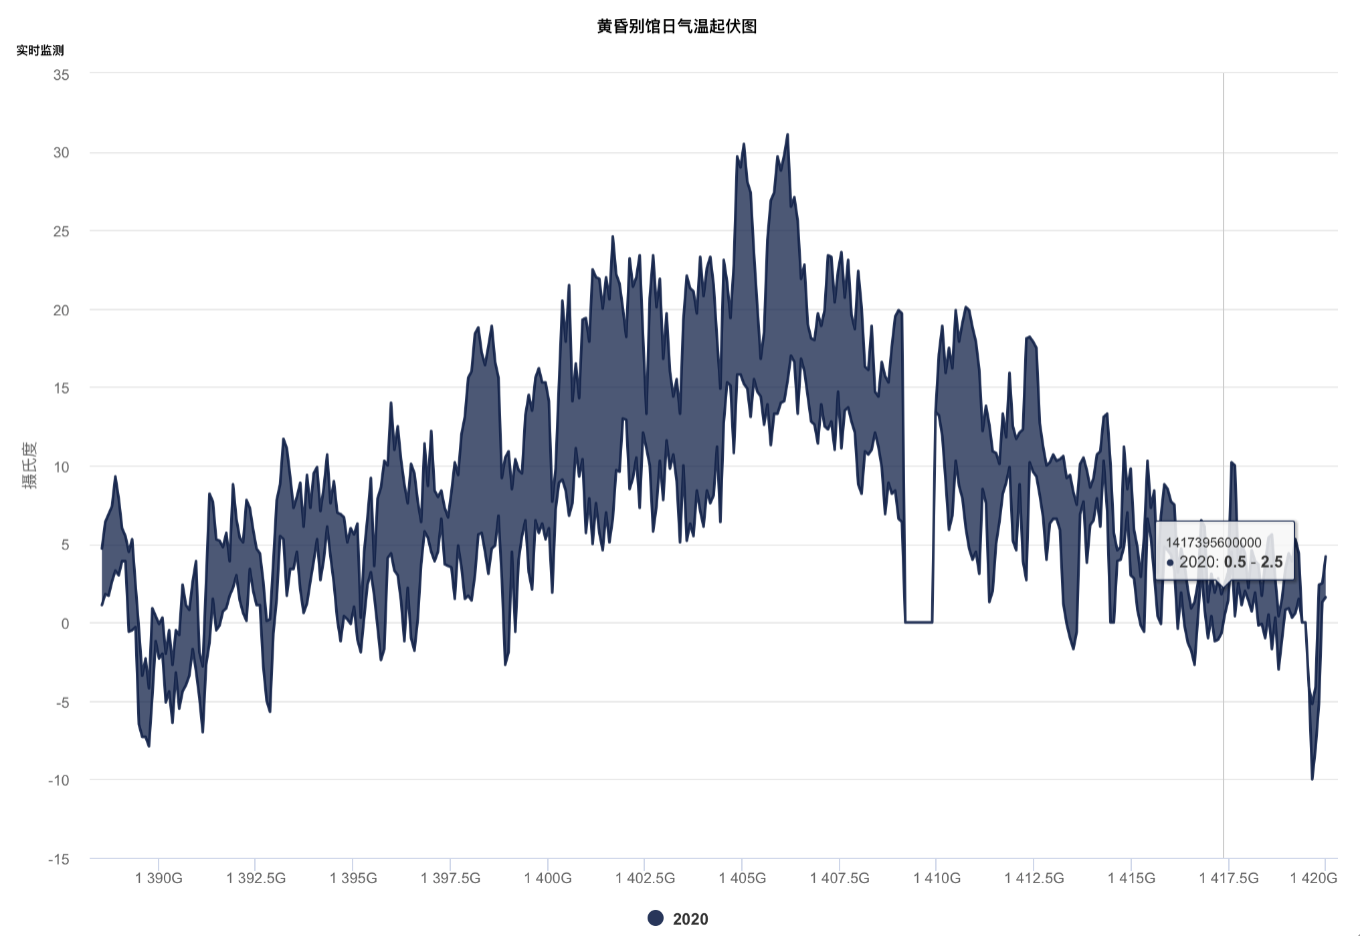
| 气泡图 | 面积范围平均值图 | 柱线混合图 |
|---|---|---|
 |
 |
 |
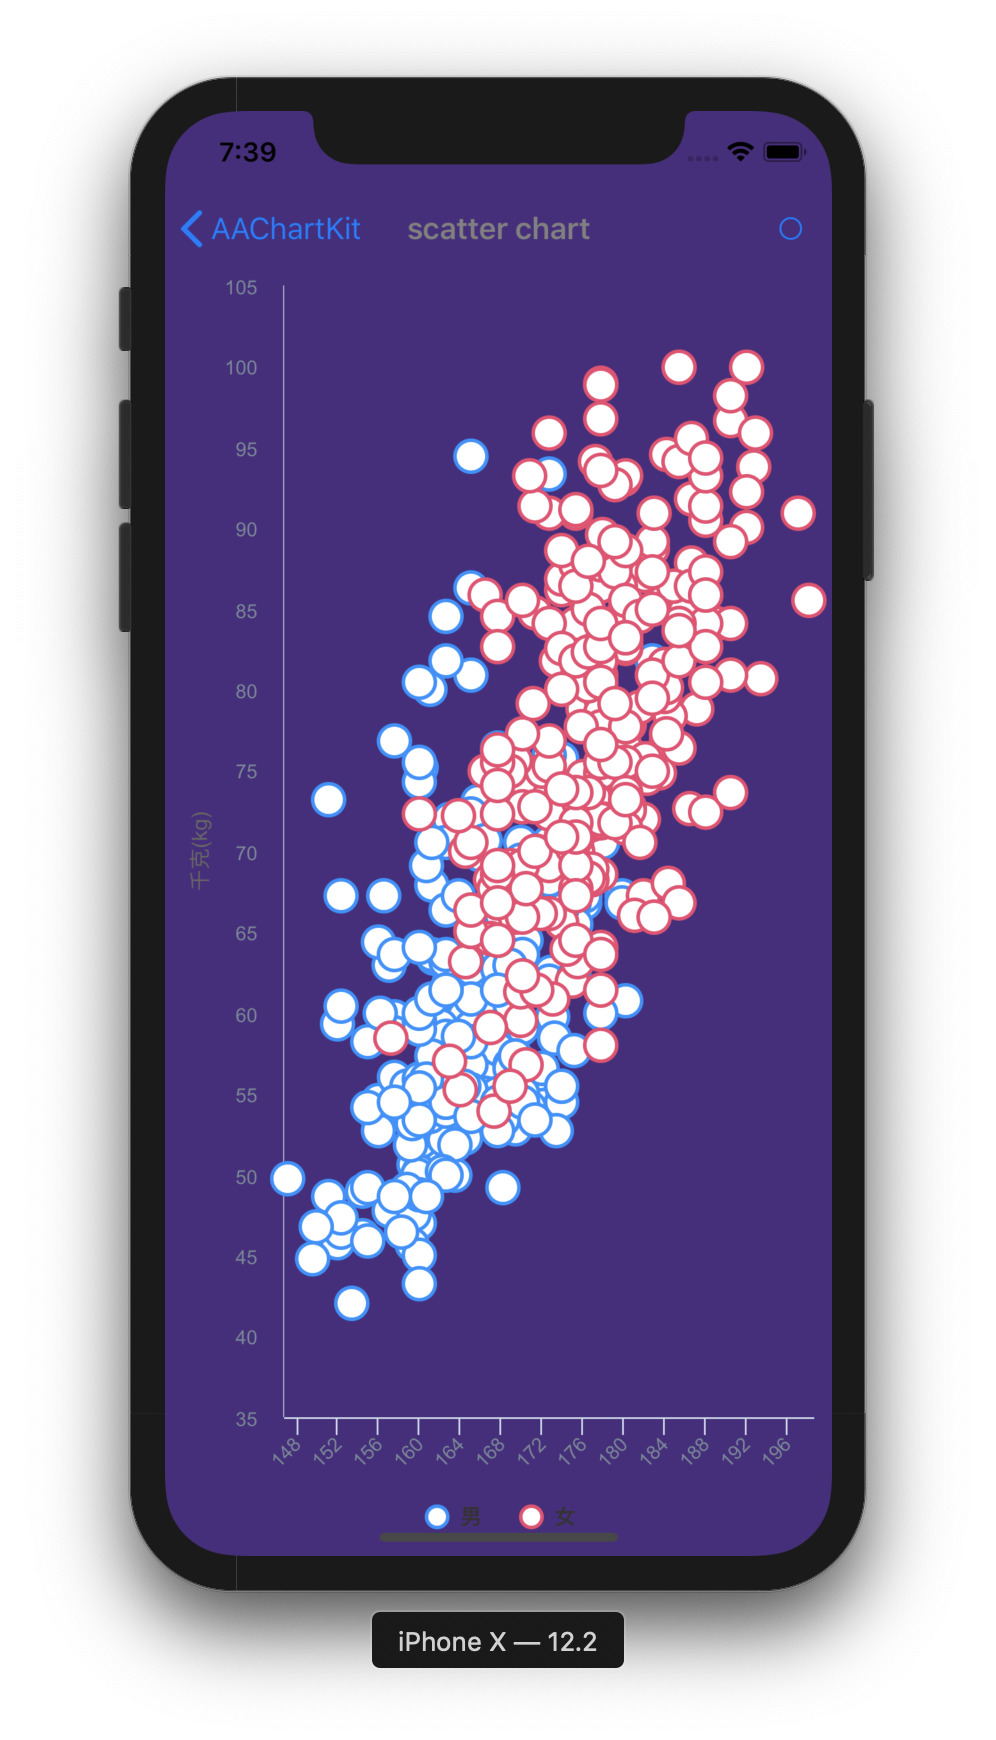
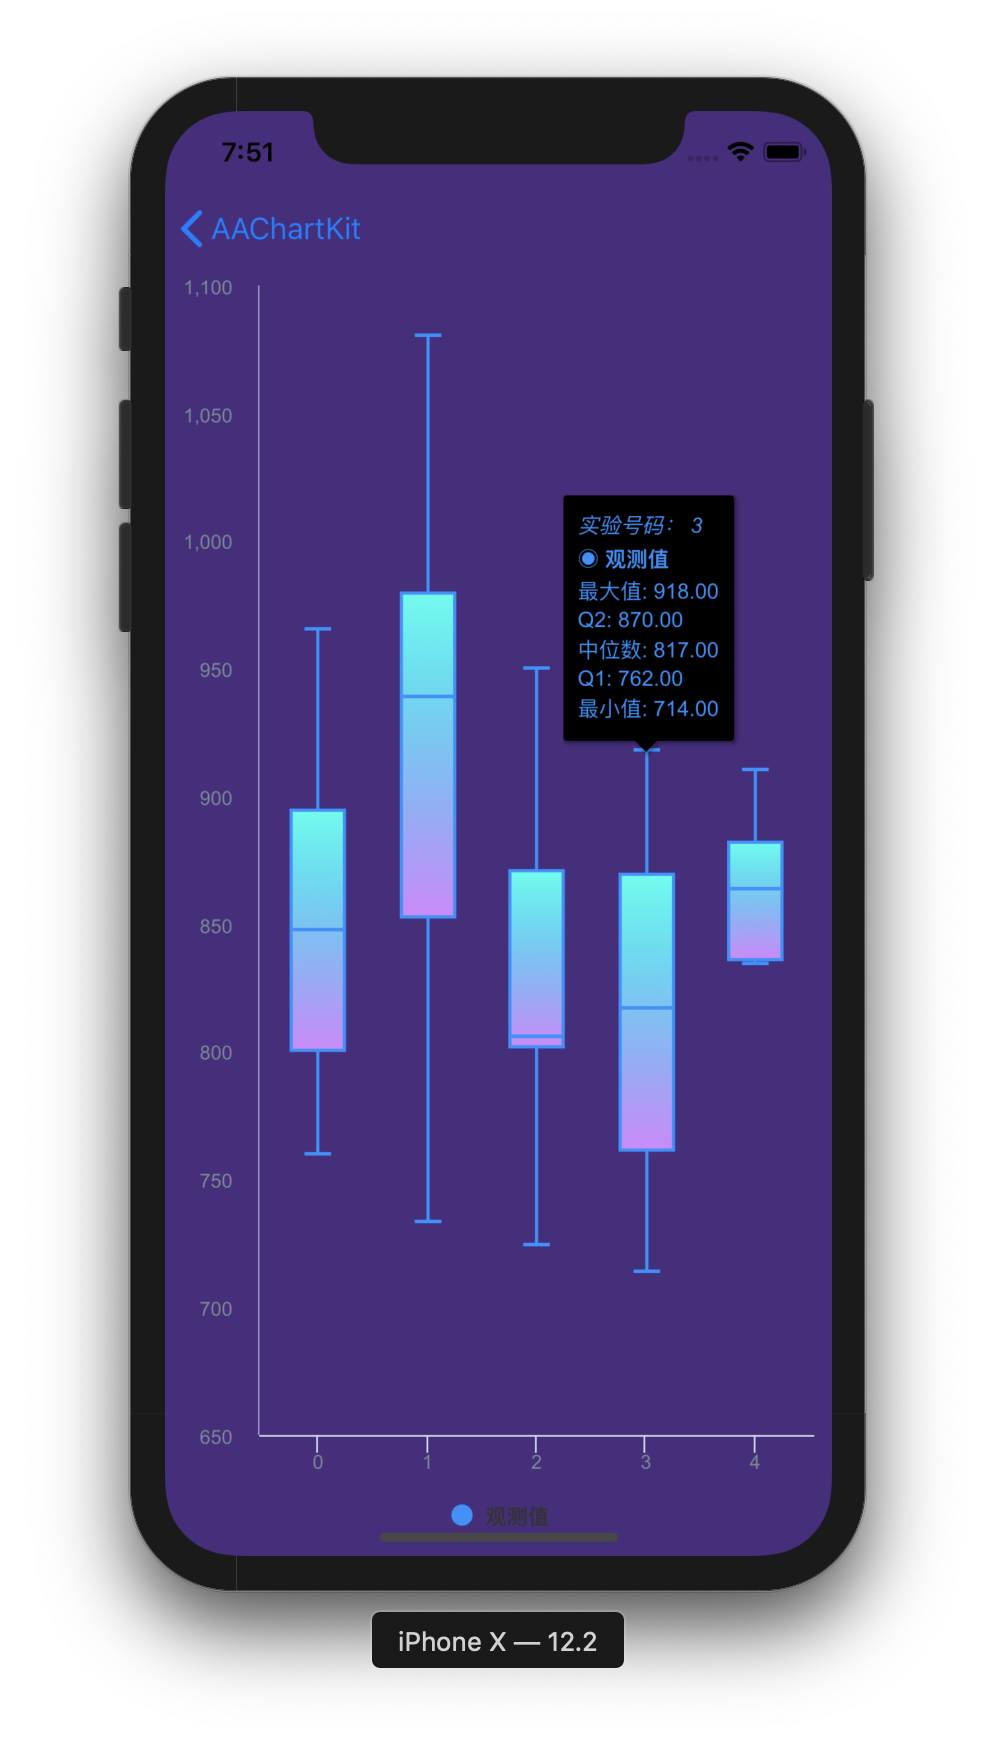
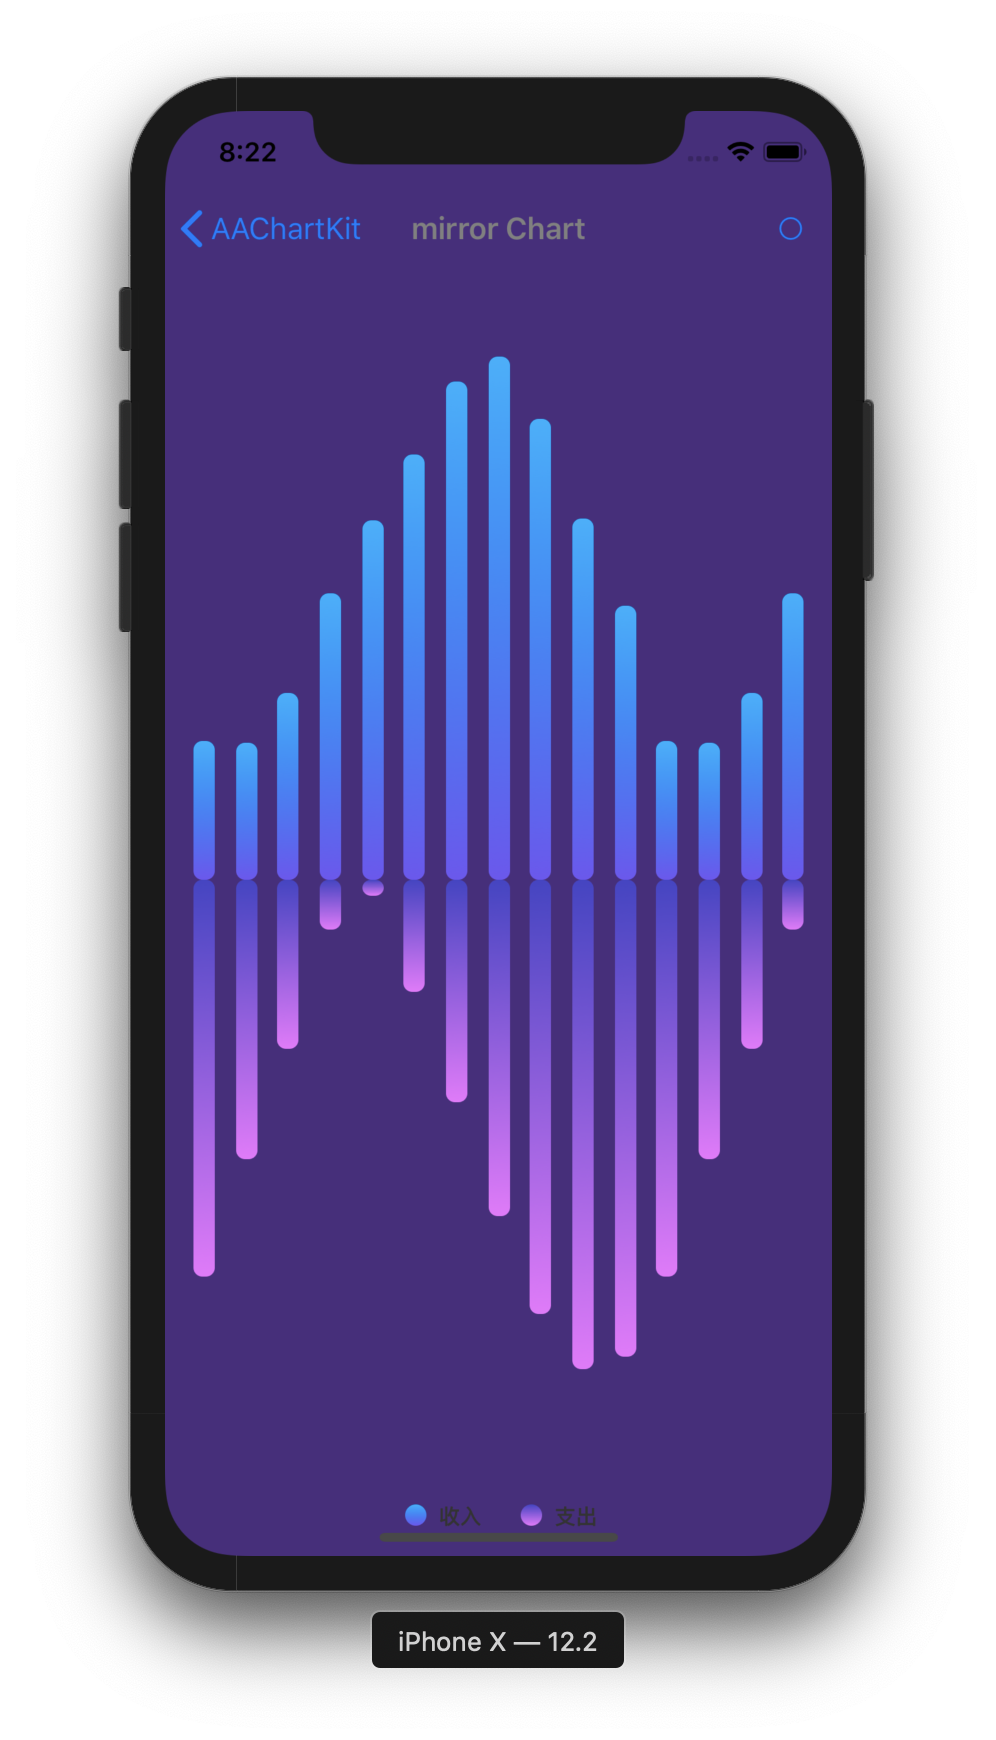
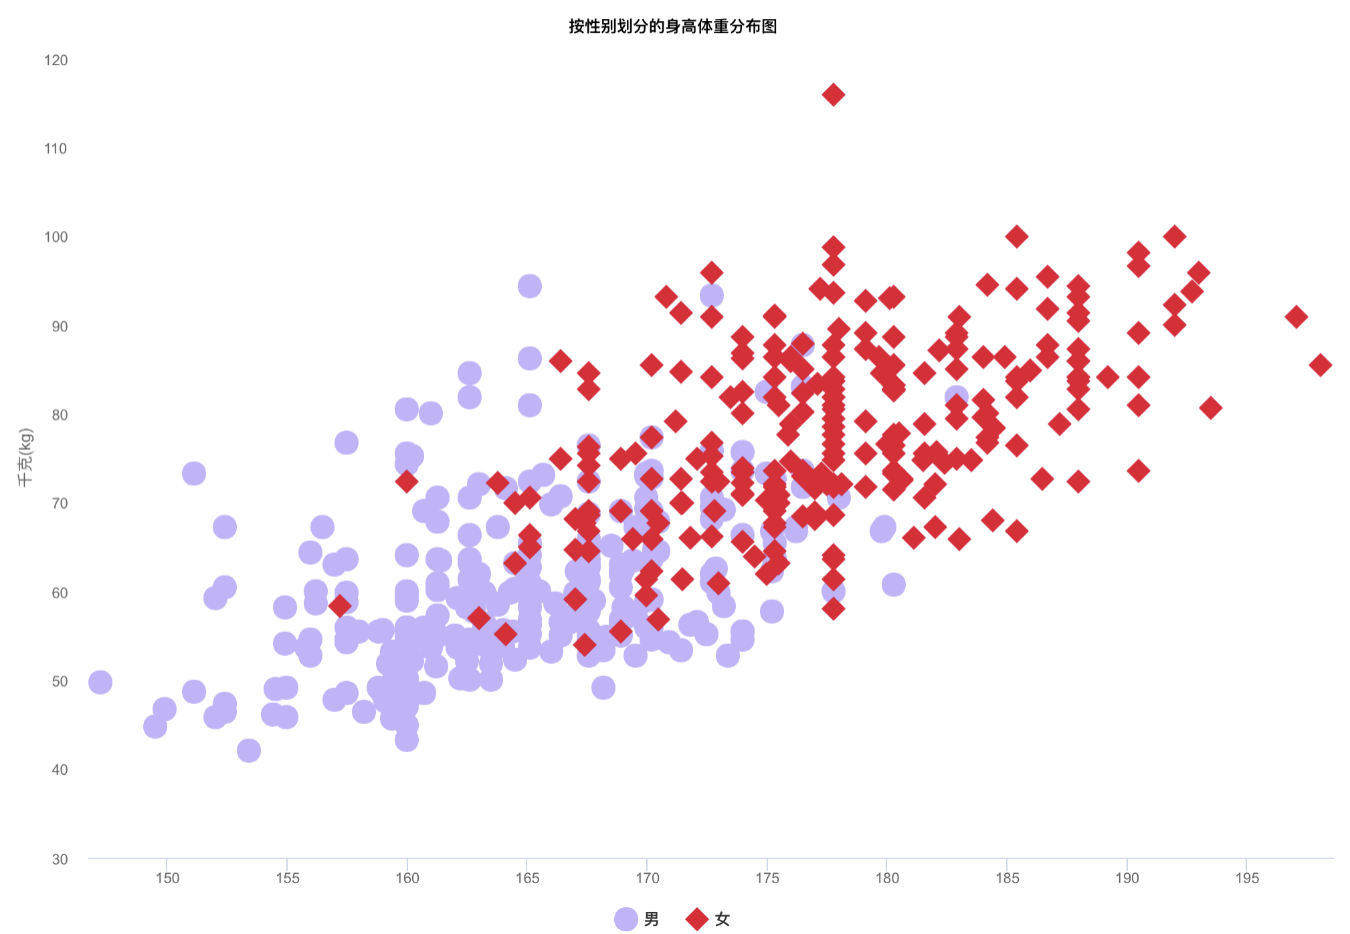
| 散点图 | 箱线图 | 镜像柱状图 |
|---|---|---|
 |
 |
 |
- 添加以下内容
pod 'AAInfographics', :git => 'https://github.com/AAChartModel/AAChartKit-Swift.git'
到你的项目 Podfile 中。
- 运行
pod install或pod update。 - 导入
AAInfographics。
- 添加以下内容
github "https://github.com/AAChartModel/AAChartKit-Swift.git" ~> 1.0
到你的项目 Cartfile 中。
- 运行
carthage bootstrap或carthage update。 - 导入
AAInfographics。
- 下载
AAInfographicsDemo的整个项目示例 - 将文件夹
AAInfographics拖到您的项目中。
- 创建图表视图的实例对象:
AAChartView
        let chartViewWidth  = self.view.frame.size.width
        let chartViewHeight = self.view.frame.size.height
        aaChartView = AAChartView()
        aaChartView?.frame = CGRect(x: 0,
                                    y: 60,
                                    width: chartViewWidth,
                                    height: chartViewHeight)
        // set the content height of aachartView
        // aaChartView?.contentHeight = self.view.frame.size.height
        self.view.addSubview(aaChartView!)
- 配置图表模型的属性:
AAChartModel
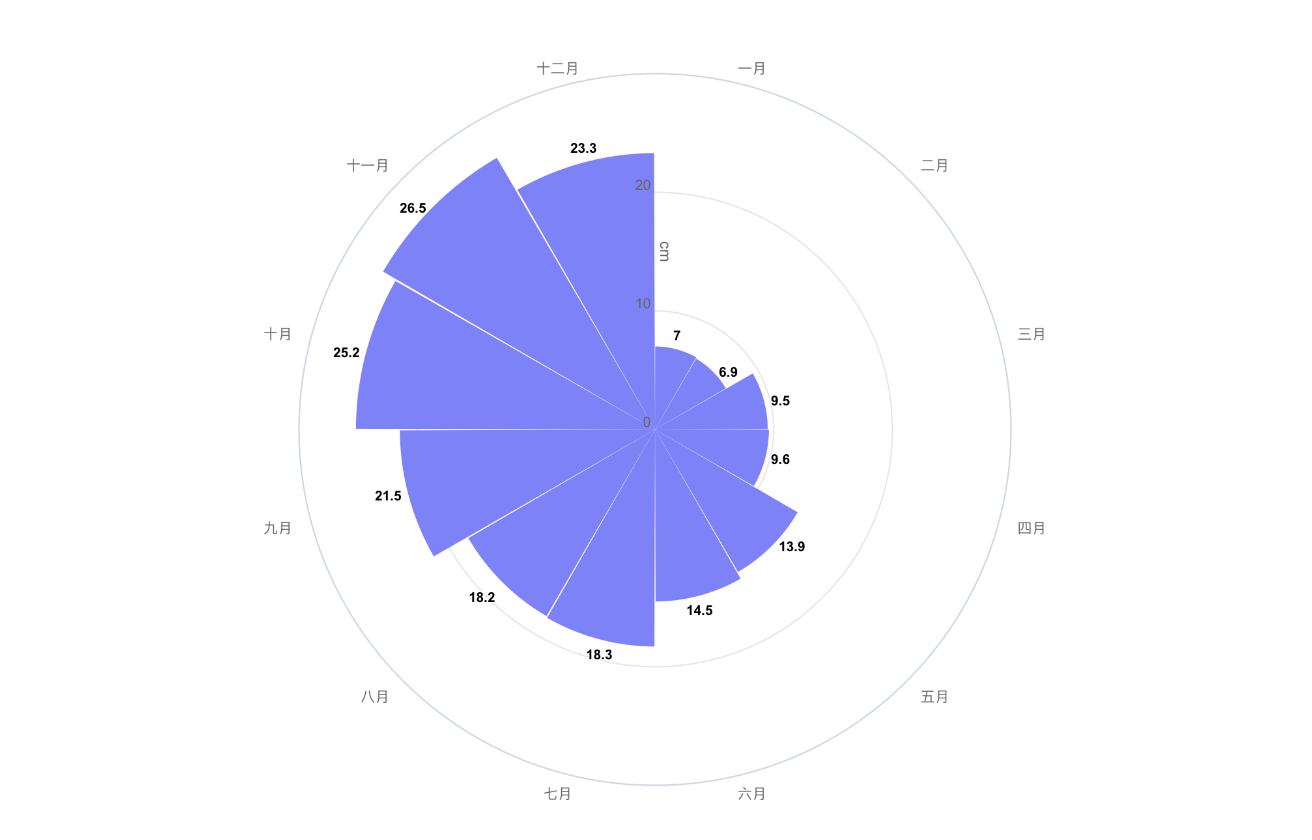
let aaChartModel = AAChartModel()
.chartType(.area)//Can be any of the chart types listed under `AAChartType`.
.animationType(.bounce)
.title("TITLE")//The chart title
.subtitle("subtitle")//The chart subtitle
.dataLabelsEnabled(false) //Enable or disable the data labels. Defaults to false
.tooltipValueSuffix("USD")//the value suffix of the chart tooltip
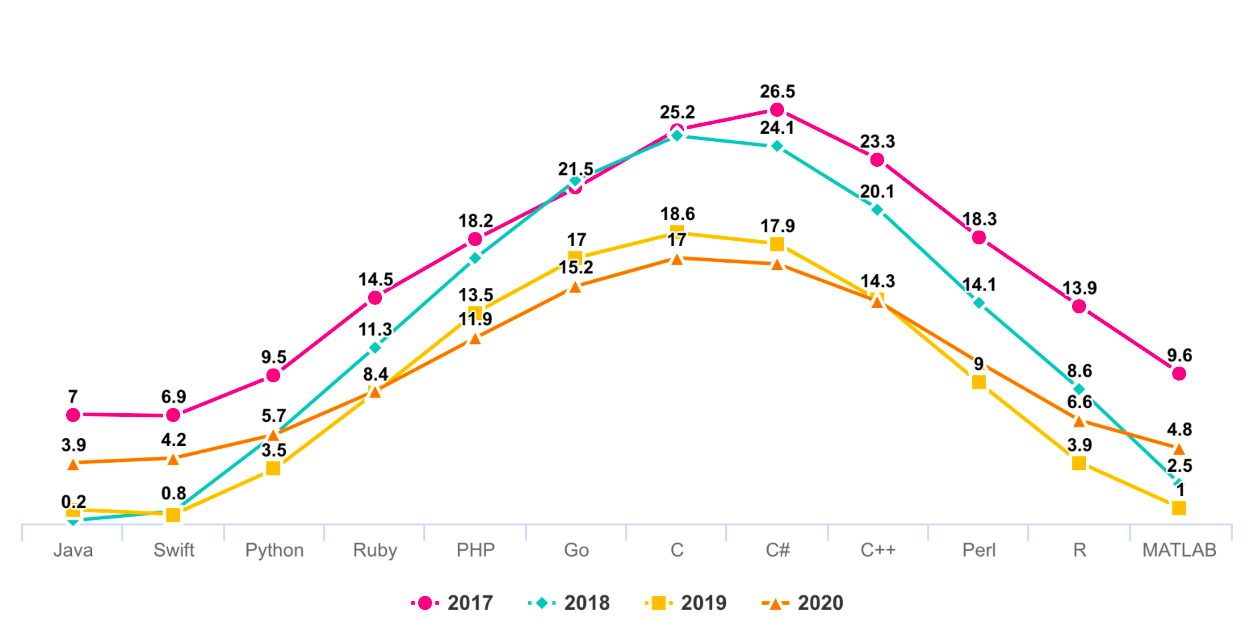
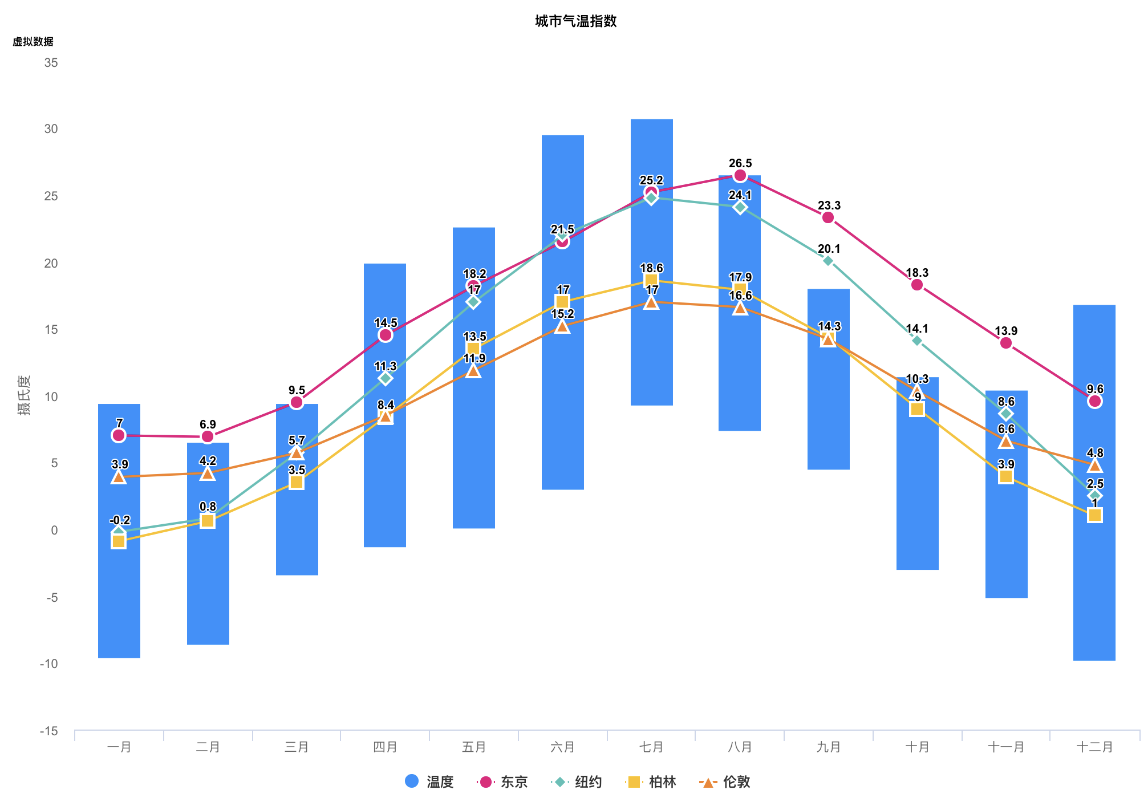
.categories(["Jan", "Feb", "Mar", "Apr", "May", "Jun",
"Jul", "Aug", "Sep", "Oct", "Nov", "Dec"])
.colorsTheme(["#fe117c","#ffc069","#06caf4","#7dffc0"])
.series([
AASeriesElement()
.name("Tokyo")
.data([7.0, 6.9, 9.5, 14.5, 18.2, 21.5, 25.2, 26.5, 23.3, 18.3, 13.9, 9.6]),
AASeriesElement()
.name("New York")
.data([0.2, 0.8, 5.7, 11.3, 17.0, 22.0, 24.8, 24.1, 20.1, 14.1, 8.6, 2.5]),
AASeriesElement()
.name("Berlin")
.data([0.9, 0.6, 3.5, 8.4, 13.5, 17.0, 18.6, 17.9, 14.3, 9.0, 3.9, 1.0]),
AASeriesElement()
.name("London")
.data([3.9, 4.2, 5.7, 8.5, 11.9, 15.2, 17.0, 16.6, 14.2, 10.3, 6.6, 4.8]),
])
- 绘制图表(此方法仅在创建 AAChartView 实例对象后的第一次调用)
        //The chart view object calls the instance object of AAChartModel and draws the final graphic
        aaChartView?.aa_drawChartWithChartModel(aaChartModel!)
🌹🌹🌹恭喜!一切都完成了!!! 你会得到你想要的!!!
如果您想刷新图表内容,您应该执行以下操作。根据您的实际需求,选择适合您的功能。
- 仅刷新图表数据(建议调用此方法以动态更新序列数据)
        //Only refresh the chart series data
        aaChartView?.aa_onlyRefreshTheChartDataWithChartModelSeries(chartModelSeriesArray)
- 刷新图表,减去图表数据(建议在第一次绘制图形完成后进行后续刷新时使用此方法。 如果只想更新图表数据,则应使用函数
aa_onlyRefreshTheChartDataWithChartModelSeries)
        //Refresh the chart after the AAChartModel whole content is updated
        aaChartView?.aa_refreshChartWholeContentWithChartModel(aaChartModel!)
- 注意:以下
DEMO 图片是一个大约 6M 大小的GIF 动态图片。如果您没有看到任何动态预览,那是因为图片资源没有完全加载。在这种情况下,请耐心等待内容加载完成。 可能需要重新加载此页面。
您可以通过实现 AAChartView 实例对象的委托函数来监控用户点击或手指移动事件消息
 //Set AAChartView events delegate
 aaChartView!.delegate = self as AAChartViewDelegate


 //implement AAChartView user click or finger move over events delegate function
extension BasicChartVC: AAChartViewDelegate {
    open func aaChartView(_ aaChartView: AAChartView, clickEventMessage: AAClickEventMessageModel) {
        print(
            """

            clicked point series element name: \(clickEventMessage.name ?? "")
            🖱🖱🖱WARNING!!!!!!!!!!!!!!!!!!!! Click Event Message !!!!!!!!!!!!!!!!!!!! WARNING🖱🖱🖱
            ==========================================================================================
            ------------------------------------------------------------------------------------------
            user finger moved over!!!,get the move over event message: {
            category = \(String(describing: clickEventMessage.category))
            index = \(String(describing: clickEventMessage.index))
            name = \(String(describing: clickEventMessage.name))
            offset = \(String(describing: clickEventMessage.offset))
            x = \(String(describing: clickEventMessage.x))
            y = \(String(describing: clickEventMessage.y))
            }
            +++++++++++++++++++++++++++++++++++++++++++++++++++++++++++++++++++++++++++++++++++++++++++


            """
        )
    }

    open func aaChartView(_ aaChartView: AAChartView, moveOverEventMessage: AAMoveOverEventMessageModel) {
        print(
            """

            moved over point series element name: \(moveOverEventMessage.name ?? "")
            ✋🏻✋🏻✋🏻✋🏻✋🏻WARNING!!!!!!!!!!!!!! Move Over Event Message !!!!!!!!!!!!!! WARNING✋🏻✋🏻✋🏻✋🏻✋🏻
            ==========================================================================================
            ------------------------------------------------------------------------------------------
            user finger moved over!!!,get the move over event message: {
            category = \(String(describing: moveOverEventMessage.category))
            index = \(String(describing: moveOverEventMessage.index))
            name = \(String(describing: moveOverEventMessage.name))
            offset = \(String(describing: moveOverEventMessage.offset))
            x = \(String(describing: moveOverEventMessage.x))
            y = \(String(describing: moveOverEventMessage.y))
            }
            +++++++++++++++++++++++++++++++++++++++++++++++++++++++++++++++++++++++++++++++++++++++++++


            """
        )
    }
}
收到的用户点击或手指移动事件包含以下内容
public class AAEventMessageModel: NSObject {
    public var name: String?
    public var x: Float?
    public var y: Float?
    public var category: String?
    public var offset: [String: Any]?
    public var index: Int?
}

public class AAClickEventMessageModel: AAEventMessageModel {}

public class AAMoveOverEventMessageModel: AAEventMessageModel {}
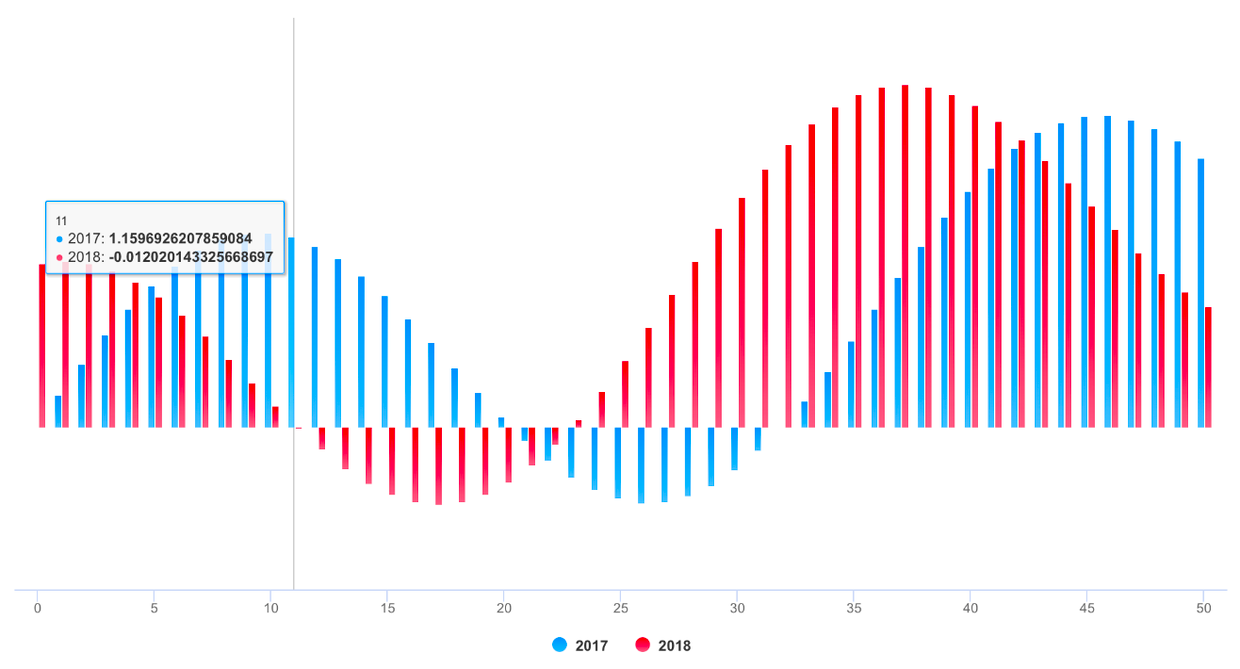
监控用户点击事件可以实现各种自定义功能。 例如,您可以通过用户点击事件回调来实现 双图联动。 示例效果如下
众所周知,AAInfographics 支持使用 HTML 字符串。 大多数情况下,headerFormat、pointFormat、footerFormat HTML 字符串足以自定义图表工具提示字符串内容,但是,有时 APP 的需求非常奇怪,无法满足,此时,您甚至可以通过 JavaScript 函数自定义图表工具提示样式。
例如
- 按如下方式配置 AATooltip 实例对象属性
         aaOptions.tooltip?
            .useHTML(true)
            .formatter("""
function () {
        return ' 🌕 🌖 🌗 🌘 🌑 🌒 🌓 🌔 <br/> '
        + ' Support JavaScript Function Just Right Now !!! <br/> '
        + ' The Gold Price For <b>2020 '
        +  this.x
        + ' </b> Is <b> '
        +  this.y
        + ' </b> Dollars ';
        }
""")
            .valueDecimals(2)//设置取值精确到小数点后几位//设置取值精确到小数点后几位
            .backgroundColor("#000000")
            .borderColor("#000000")
            .style(AAStyle()
                .color("#FFD700")
                .fontSize(12)
        )
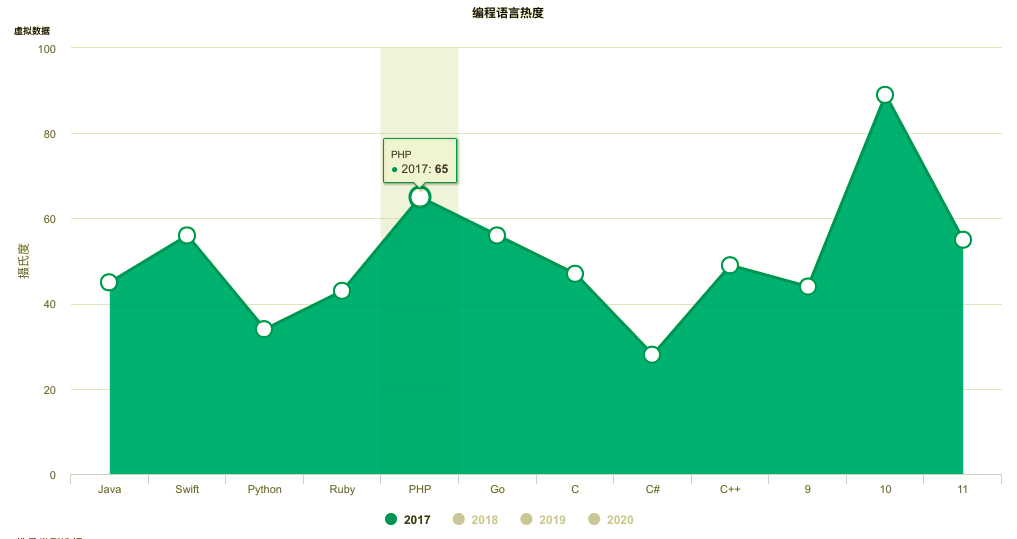
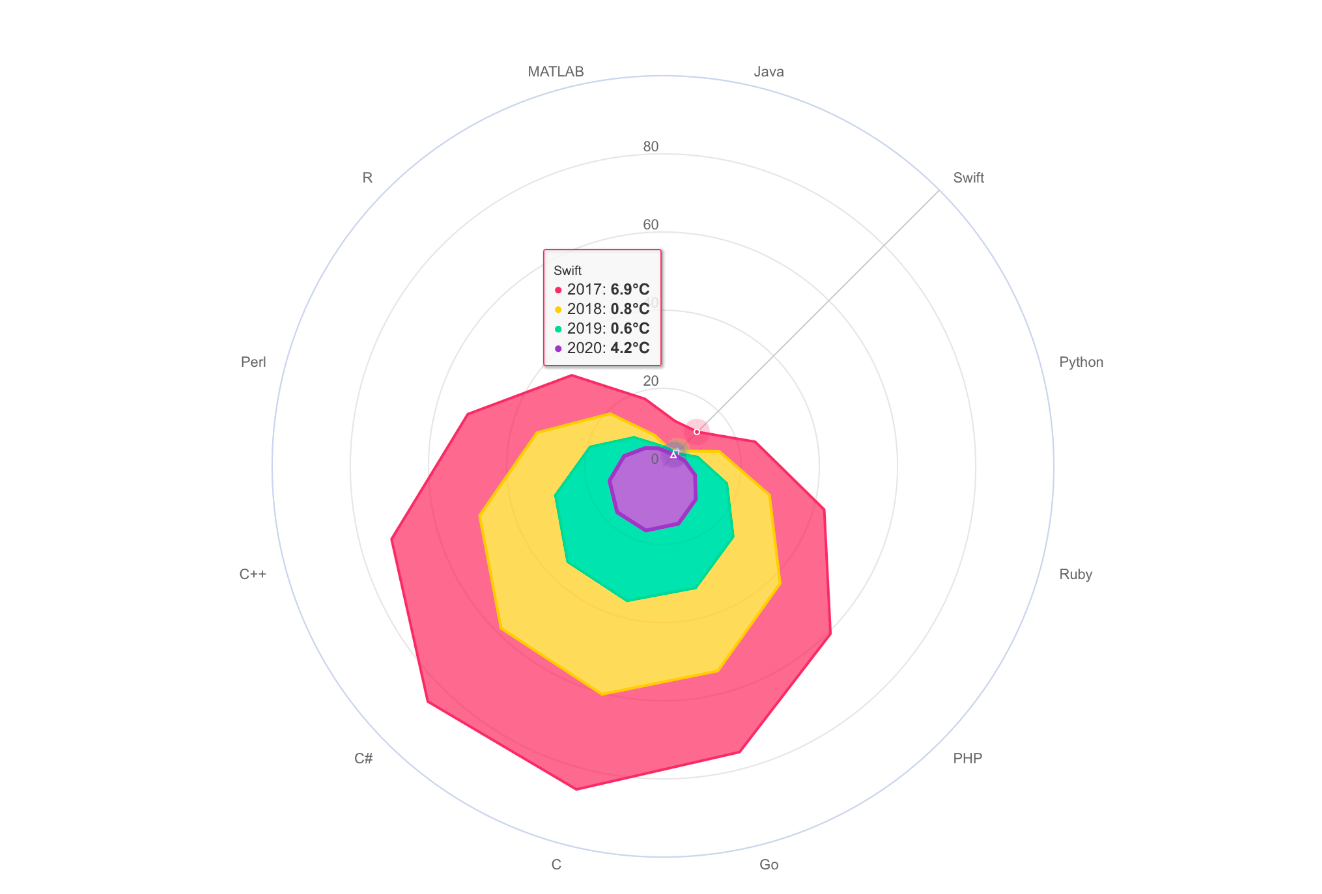
您可以获得如下的自定义工具提示样式图表👇 
- 按如下方式配置 AATooltip 实例对象属性
        aaOptions.tooltip?
            .useHTML(true)
            .formatter(#"""
function () {
        let wholeContentStr ='<span style=\"' + 'color:lightGray; font-size:13px\"' + '>◉ Time: ' + this.x + ' year</span><br/>';
        let length = this.points.length;
        for (let i = 0; i < length; i++) {
            let thisPoint = this.points[i];
            let yValue = thisPoint.y;
            if (yValue != 0) {
                let spanStyleStartStr = '<span style=\"' + 'color:'+ thisPoint.color + '; font-size:13px\"' + '>◉ ';
                let spanStyleEndStr = '</span> <br/>';
                wholeContentStr += spanStyleStartStr + thisPoint.series.name + ': ' + thisPoint.y + '℃' + spanStyleEndStr;
            }
        }
        return wholeContentStr;
    }
"""#)
            .backgroundColor("#050505")
            .borderColor("#050505")
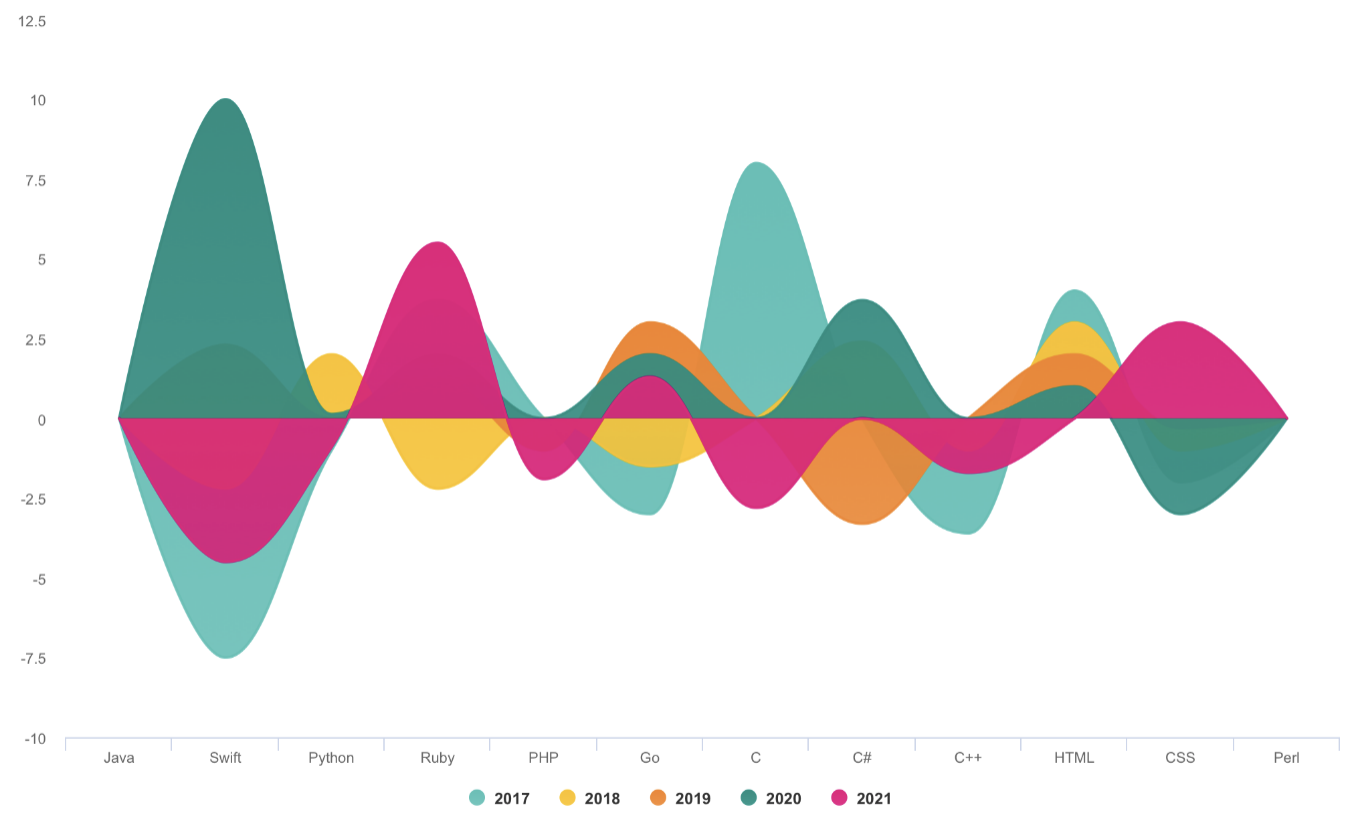
您可以获得如下的自定义工具提示样式图表👇 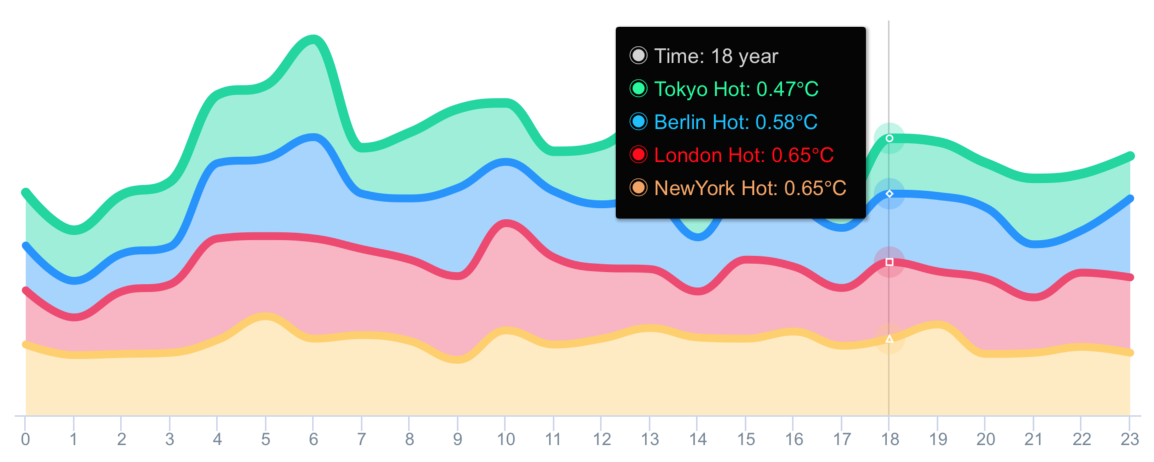
-
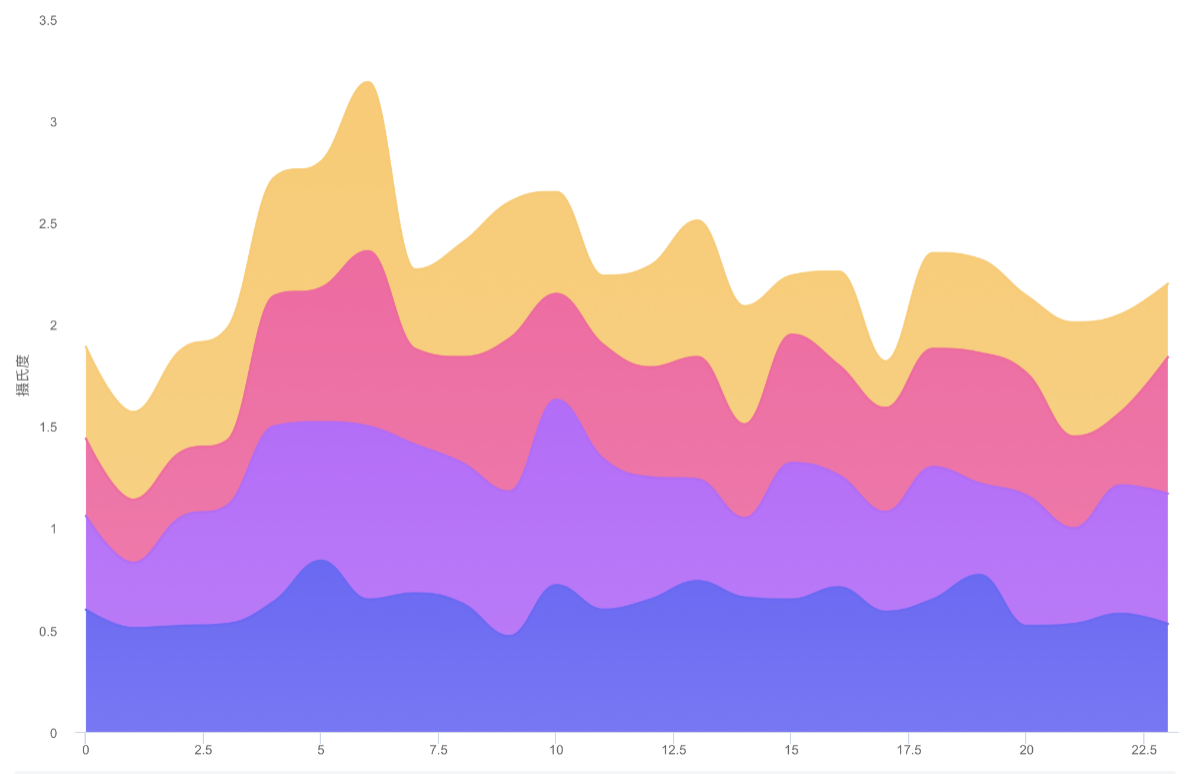
带有值范围分段的图表
bands 🎀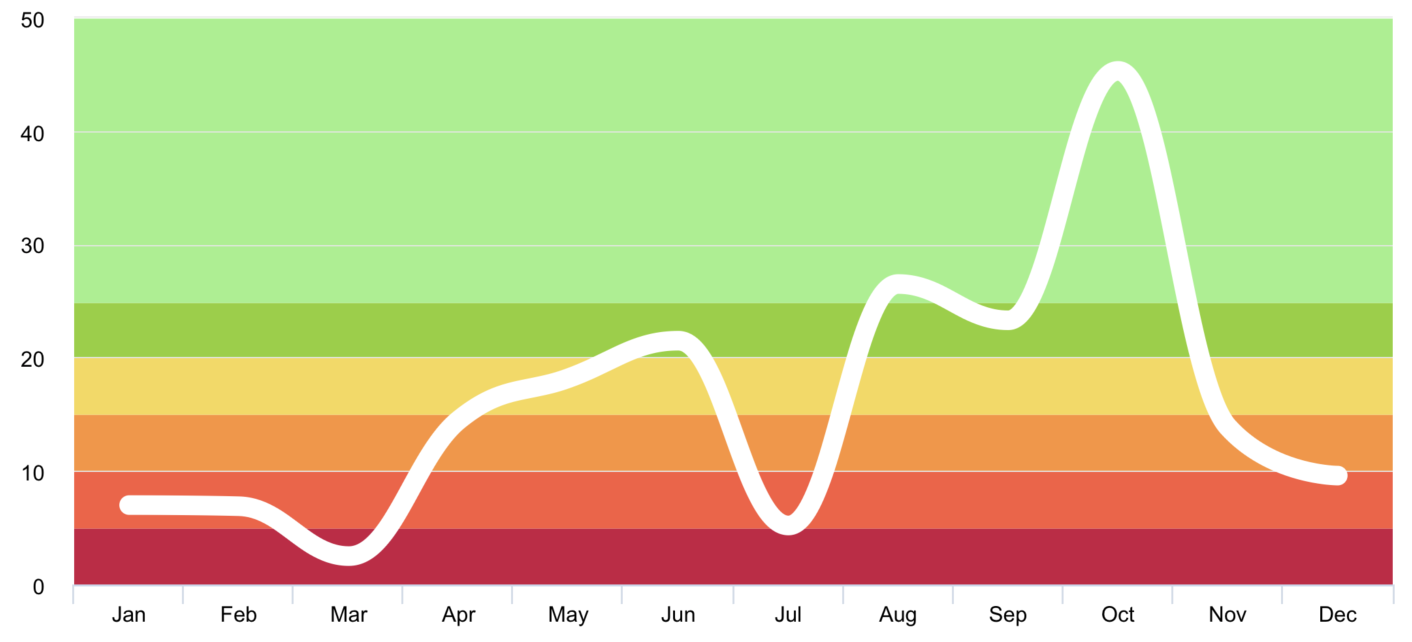
-
带有值范围分段的图表
lines 🧶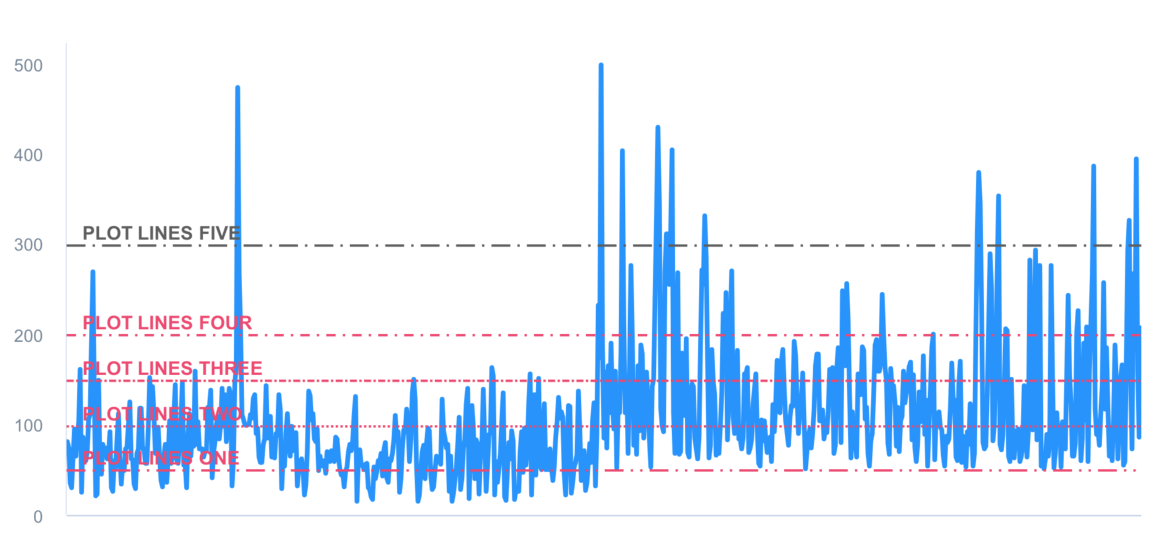
-
带有值范围分段的图表
zones 🧱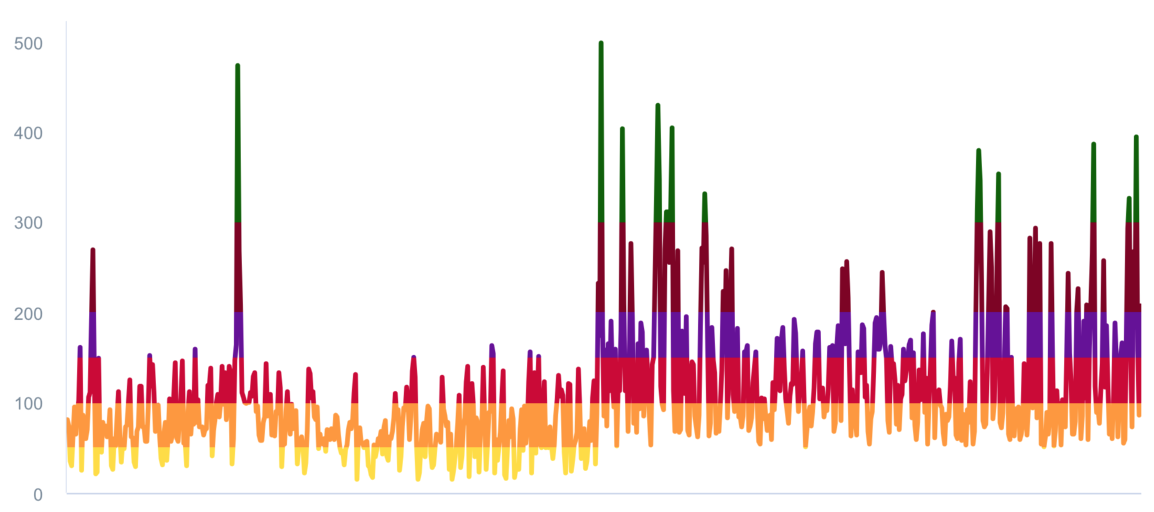

public enum AAChartType: String {
case column //Column series display one column per value along an X axis.
case bar //A bar series is a special type of column series where the columns are horizontal.
case area //The area series type.
case areaspline //The area spline series is an area series where the graph between the points is smoothed into a spline.
case line //A line series displays information as a series of data points connected by straight line segments.
case spline //A spline series is a special type of line series, where the segments between the data points are smoothed.
case scatter //A scatter plot uses cartesian coordinates to display values for two variables for a set of data.
case pie //A pie chart is a circular graphic which is divided into slices to illustrate numerical proportion.
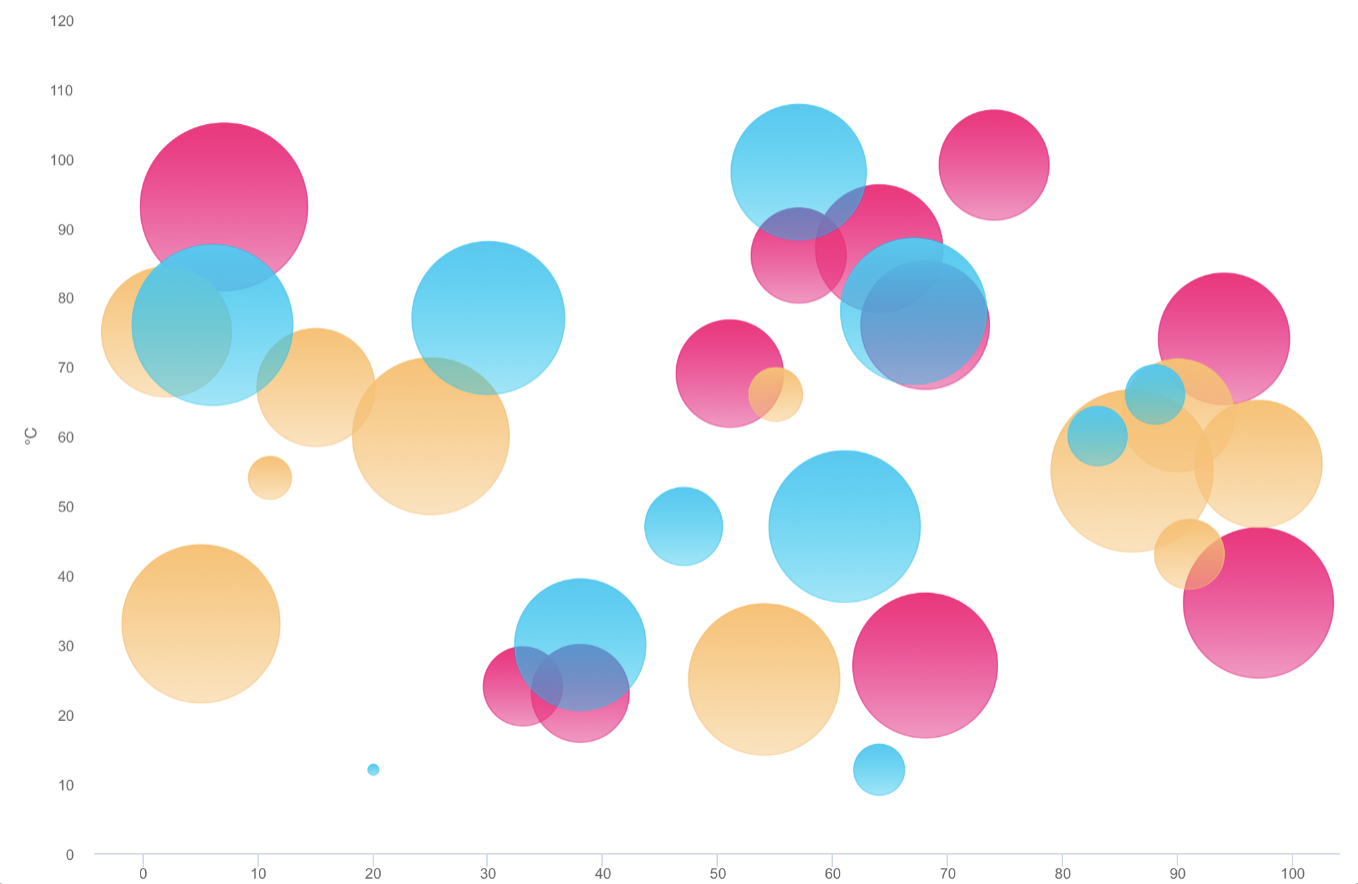
case bubble //A bubble series is a three dimensional series type where each point renders an X, Y and Z value. Each points is drawn as a bubble where the position along the X and Y axes mark the X and Y values, and the size of the bubble relates to the Z value.
case pyramid //A pyramid series is a special type of funnel, without neck and reversed by default.
case funnel //Funnel charts are a type of chart often used to visualize stages in a sales project, where the top are the initial stages with the most clients. It requires that the modules/funnel.js file is loaded.
case columnrange //The column range is a cartesian series type with higher and lower Y values along an X axis. To display horizontal bars, set chart.inverted to true.
case arearange //The area range series is a carteseian series with higher and lower values for each point along an X axis, where the area between the values is shaded.
case areasplinerange //The area spline range is a cartesian series type with higher and lower Y values along an X axis. The area inside the range is colored, and the graph outlining the area is a smoothed spline.
case boxplot //A box plot is a convenient way of depicting groups of data through their five-number summaries: the smallest observation (sample minimum), lower quartile (Q1), median (Q2), upper quartile (Q3), and largest observation (sample maximum).
case waterfall //A waterfall chart displays sequentially introduced positive or negative values in cumulative columns.
case polygon //A polygon series can be used to draw any freeform shape in the cartesian coordinate system. A fill is applied with the color option, and stroke is applied through lineWidth and lineColor options.
case gauge //Gauges are circular plots displaying one or more values with a dial pointing to values along the perimeter.
case errorbar //Error bars are a graphical representation of the variability of data and are used on graphs to indicate the error, or uncertainty in a reported measurement.
}
enum AAChartZoomType: String {
    case none = "none"
    case x    = "x"
    case y    = "y"
    case xy   = "xy"
}
public enum AAChartLineDashStyleType: String {
    case solid           //———————————————————————————————————
    case shortDash       //— — — — — — — — — — — — — — — — — —
    case shortDot        //ⵈⵈⵈⵈⵈⵈⵈⵈⵈⵈⵈⵈⵈⵈⵈⵈⵈⵈⵈⵈⵈⵈⵈⵈⵈⵈⵈⵈ
    case shortDashDot    //—‧—‧—‧—‧—‧—‧—‧—‧—‧—‧—‧—‧—‧—‧—‧—‧—‧—‧
    case shortDashDotDot //—‧‧—‧‧—‧‧—‧‧—‧‧—‧‧—‧‧—‧‧—‧‧—‧‧—‧‧—‧‧
    case dot             //‧‧‧‧‧‧‧‧‧‧‧‧‧‧‧‧‧‧‧‧‧‧‧‧‧‧‧‧‧‧‧‧‧‧‧
    case dash            //—— —— —— —— —— —— —— —— —— —— —— ——
    case longDash        //——— ——— ——— ——— ——— ——— ——— ——— ———
    case dashDot         //——‧——‧——‧——‧——‧——‧——‧——‧——‧——‧——‧——‧
    case longDashDot     //———‧———‧———‧———‧———‧———‧———‧———‧———‧
    case longDashDotDot  //———‧‧———‧‧———‧‧———‧‧———‧‧———‧‧———‧‧
}
 public enum AAChartAnimationType: String {
    case easeInQuad     = "easeInQuad"
    case easeOutQuad    = "easeOutQuad"
    case easeInOutQuad  = "easeInOutQuad"
    case easeInCubic    = "easeInCubic"
    case easeOutCubic   = "easeOutCubic"
    case easeInOutCubic = "easeInOutCubic"
    case easeInQuart    = "easeInQuart"
    case easeOutQuart   = "easeOutQuart"
    case easeInOutQuart = "easeInOutQuart"
    case easeInQuint    = "easeInQuint"
    case easeOutQuint   = "easeOutQuint"
    case easeInOutQuint = "easeInOutQuint"
    case easeInSine     = "easeInSine"
    case easeOutSine    = "easeOutSine"
    case easeInOutSine  = "easeInOutSine"
    case easeInExpo     = "easeInExpo"
    case easeOutExpo    = "easeOutExpo"
    case easeInOutExpo  = "easeInOutExpo"
    case easeInCirc     = "easeInCirc"
    case easeOutCirc    = "easeOutCirc"
    case easeInOutCirc  = "easeInOutCirc"
    case easeOutBounce  = "easeOutBounce"
    case easeInBack     = "easeInBack"
    case easeOutBack    = "easeOutBack"
    case easeInOutBack  = "easeInOutBack"
    case elastic        = "elastic"
    case swingFromTo    = "swingFromTo"
    case swingFrom      = "swingFrom"
    case swingTo        = "swingTo"
    case bounce         = "bounce"
    case bouncePast     = "bouncePast"
    case easeFromTo     = "easeFromTo"
    case easeFrom       = "easeFrom"
    case easeTo         = "easeTo"
}
以下是 AAInfographics 的十种具体动画类型
| Back | Bounce | Circ | Cubic | Elastic |
|---|---|---|---|---|
 |
 |
 |
 |
 |
| Expo | Quad | Quart | Quint | Sine |
|---|---|---|---|---|
 |
 |
 |
 |
 |
| 属性名 | 属性类型 | 描述 | 值范围 |
|---|---|---|---|
| title | String | 图表标题 | 任何有效的字符串 |
| subtitle | String | 图表副标题 | 任何有效的字符串 |
| chartType | AAChartType | 图表的默认序列类型。可以是 AAChartType 下列出的任何图表类型。 |
.column, .bar, .area, .areaSpline, .line, .spline, .pie, .bubble, .scatter, .pyramid, .funnel, .areaRange, .columnRange |
| stacking | AAChartStackingType | 是否将每个序列的值堆叠在一起。 可能的值为 null(禁用)、“normal”(按值堆叠)或“percent”。 启用堆叠后,数据必须按升序 X 排序 | .none, .normal, .percent |
| symbol | AAChartSymbolType | 标记的预定义形状或符号。 当为 null 时,符号从 options.symbols 中提取。 其他可能的值为“circle”、“square”、“diamond”、“triangle”和“triangle-down” | .circle, .square, .diamond, .triangle, .triangleDown |
public class AAChartModel: AAObject {
    public var animationType: AAChartAnimationType? //The type of chart animation
    public var animationDuration: Int?      //The chart rendering animation duration
    public var title: String?               //The chart title
    public var titleStyle: AAStyle?         //The chart title style
    public var subtitle: String?            //The chart subtitle
    public var subtitleAlign: AAChartAlignType?//The chart subtitle text align style
    public var subtitleStyle: AAStyle?      //The chart subtitle style
    public var chartType: AAChartType?      //The default series type for the chart. Can be any of the chart types listed under `AAChartType`. Defaults to line
    public var stacking: AAChartStackingType? //Whether to stack the values of each series on top of each other. Possible values are null to disable, "normal" to stack by value or "percent". When stacking is enabled, data must be sorted in ascending X order
    public var markerSymbol: AAChartSymbolType?   //A predefined shape or symbol for the marker. When null, the symbol is pulled from options.symbols. Other possible values are "circle", "square", "diamond", "triangle" and "triangle-down"
    public var markerSymbolStyle: AAChartSymbolStyleType?
    public var zoomType: AAChartZoomType?   //Decides in what dimensions the user can zoom by dragging the mouse. Can be one of x, y or xy
    public var inverted: Bool?              //Whether to invert the axes so that the x axis is vertical and y axis is horizontal. When true, the x axis is reversed by default. If a bar series is present in the chart, it will be inverted automatically.Inverting the chart doesn't have an effect if there are no cartesian series in the chart, or if the chart is polar.Defaults to false
    public var xAxisReversed: Bool?         //Whether to reverse the axis so that the highest number is closest to the origin. If the chart is inverted, the x axis is reversed by default. Defaults to false
    public var yAxisReversed: Bool?         //Whether to reverse the axis so that the highest number is closest to the origin. If the chart is inverted, the x axis is reversed by default. Defaults to false
    public var polar: Bool?                 //When true, cartesian charts like line, spline, area and column are transformed into the polar coordinate system. Requires `AAHighchartsMore.js`. Defaults to false
    public var margin: [Any?]?
    public var dataLabelsEnabled: Bool?     //Enable or disable the data labels. Defaults to false
    public var dataLabelsStyle: AAStyle?    //The data labels style
    public var xAxisLabelsEnabled: Bool?    //Enable or disable the axis labels. Defaults to true
    public var xAxisLabelsStyle: AAStyle?   //The x axis labels style
    public var categories: [String]?        //Set new categories for the axis
    public var xAxisGridLineWidth: Float?   //The width of the grid lines extending the ticks across the plot area.Defaults to 0
    public var xAxisVisible: Bool?          //Show the x axis or not
    public var xAxisTickInterval: Float?    //Custom x axis tick interval,It is useful when the x categories array is too long to show all of them
    public var yAxisVisible: Bool?          //Show the y axis or not
    public var yAxisLabelsEnabled: Bool?    //Enable or disable the axis labels. Defaults to true
    public var yAxisLabelsStyle: AAStyle?   //The y axis labels style
    public var yAxisTitle: String?          //The actual text of the axis title
    public var xAxisTitle: String?          //The actual text of the axis title
    public var yAxisLineWidth: Float?       //The width of y axis line
    public var yAxisGridLineWidth: Float?   //The width of the grid lines extending the ticks across the plot area. Defaults to 1
    public var yAxisMin: Double?            //The y axis mini value
    public var yAxisMax: Double?            //The y axis max value
    public var yAxisTickPositions:[Any]?    //An array defining where the ticks are laid out on the axis. This overrides the default behaviour of tickPixelInterval and tickInterval.
    public var yAxisAllowDecimals: Bool?    //The y axis values label allow decimals or not
    public var tooltipEnabled: Bool?        //Show the tooltip or not
    public var tooltipValueSuffix: String?  //Custom tooltip value unit suffix
    public var colorsTheme: [Any]?          //An array containing the default colors for the chart's series. When all colors are used, new colors are pulled from the start again. Defaults to: ["#bb250c","#f67210","#fde680","#257679","#f1c6c5"]
    public var series: [Any]?               //An array of all the chart's series
    public var legendEnabled: Bool?         //Enable or disable the legend. Defaults to true
    public var backgroundColor: Any?        //The background color or gradient for the outer chart area. Defaults to #FFFFFF
    public var borderRadius: Float?         //The corner radius of the outer chart border. Defaults to 0
    public var markerRadius: Float?         //The radius of the point marker. Defaults to 4
    public var scrollablePlotArea: AAScrollablePlotArea?    //Scroll properties if supported

    ...
    ...
}

 "CODE IS FAR AWAY FROM BUG WITH THE ANIMAL PROTECTING"

 *          ##2      ##2
 *       ┏-##1   ┏-##1
 *    ┏_┛ ┻---━┛_┻━━┓
 *    ┃           ┃
 *    ┃   ━       ┃
 *    ┃ @^   @^    ┃
 *    ┃        ┃
 *    ┃   ┻    ┃
 *    ┃_      _┃
 *     ┗━┓   ┏━┛
 *      ┃   ┃神兽保佑
 *      ┃   ┃永无BUG!
 *      ┃   ┗━━━┓----|
 *      ┃         ┣┓}}}
 *      ┃         ┏┛
 *      ┗┓&&&┓-┏&&&┓┏┛-|
 *       ┃┫┫  ┃┫┫
 *       ┗┻┛  ┗┻┛
 *
 *
 "CODE IS FAR AWAY FROM BUG WITH THE ANIMAL PROTECTING"
| 语言 | 项目名称 | 目标平台 | 源代码链接 |
|---|---|---|---|
| Swift | AAInfographics | AAInfographics | iOS |
| https://github.com/AAChartModel/AAChartKit-Swift | Objective C | AAInfographics | https://github.com/AAChartModel/AAChartKit |
| AAChartKit | AAInfographics | Kotlin | Android |
| https://github.com/AAChartModel/AAChartCore-Kotlin | Java | Kotlin | AAChartCore |
Pro 版本
| 语言 | 项目名称 | 目标平台 | 源代码链接 |
|---|---|---|---|
| Swift | Pro 版本是更强大的数据可视化框架,支持更多类型的漂亮图表,如 bellcurve, bullet, columnpyramid, cylinder, dependencywheel, heatmap, histogram, networkgraph, organization, packedbubble, pareto, sankey, series, solidgauge, streamgraph, sunburst, tilemap, timeline, treemap, variablepie, variwide, vector, venn, windbarb, wordcloud, xrange 图表等等。 | AAInfographics | AAInfographics-Pro |
| https://github.com/AAChartModel/AAChartKit-Swift | https://github.com/AAChartModel/AAChartKit-Swift-Pro | AAInfographics | AAChartKit-Pro |
| AAChartKit | Pro 版本是更强大的数据可视化框架,支持更多类型的漂亮图表,如 bellcurve, bullet, columnpyramid, cylinder, dependencywheel, heatmap, histogram, networkgraph, organization, packedbubble, pareto, sankey, series, solidgauge, streamgraph, sunburst, tilemap, timeline, treemap, variablepie, variwide, vector, venn, windbarb, wordcloud, xrange 图表等等。 | Kotlin | https://github.com/AAChartModel/AAChartKit-Pro |
| https://github.com/AAChartModel/AAChartCore-Kotlin | 即将推出... | Kotlin | https://github.com/AAChartModel/AAChartKit-Pro |
![]()
LICENSE
AAInfographics 在 MIT 许可下可用。 有关更多信息,请参见 LICENSE 文件。
- 联系方式
- 🌕 🌖 🌗 🌘 温馨提示!!! 🌑 🌒 🌓 🌔
- 如果在使用中遇到任何问题,请在 GitHub 上与我联系。
- GitHub Issues : https://github.com/AAChartModel/AAChartKit-Swift/issues
- 如果您想为这个项目做出贡献,也请与我联系
- GitHub : https://github.com/AAChartModel
- StackOverflow : https://stackoverflow.com/users/7842508/codeforu
- JianShu : http://www.jianshu.com/u/f1e6753d4254
SegmentFault : https://segmentfault.com/u/huanghunbieguan
- 待办事项列表
- 支持用户在图形内容加载完成后添加委托事件
- 支持图形动态刷新全局内容
- 支持图形动态刷新纯数据(
series)内容 - 支持 3D 图形效果,仅对部分图形有效,例如
柱状图、条形图、饼图、散点图、气泡图等 - 支持横屏(全屏)效果
- 支持自由设置图形渲染动画
- 支持用户自由配置
AAOptions模型对象的属性 - 支持堆叠图形
- 支持反转图形轴
- 支持渲染散点图
- 支持渲染柱状范围图
- 支持渲染面积范围图
- 支持渲染极坐标图
- 支持渲染阶梯线图
- 支持渲染阶梯面积图
- 支持渲染矩形树状结构图
- 支持渲染圆形进度条图
- 支持为图形添加点击事件回调
- 支持为图形添加手指✋🏻或鼠标🖱悬停事件回调
- 支持图形实时刷新纯数据并动态滚动
- 支持将渲染的图形生成图像文件
- 支持将生成的图像文件保存到系统相册