LightChart 是一个轻量级的 SwiftUI 包,实现了折线图功能。当您只需要一个能够完美融入您的视图的图表时,可以使用它。它没有任何交互、标题、不同类型的图表或任何其他功能,仅仅是您的数据集的可视化表示。
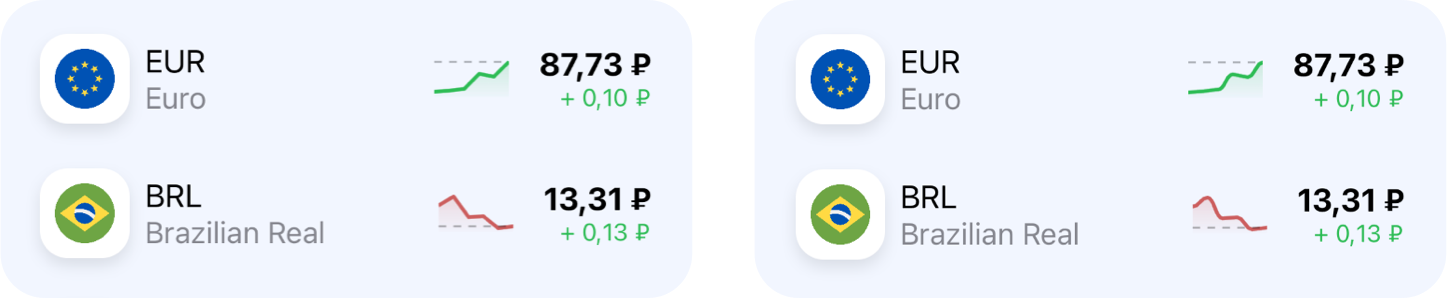
目前 LightChart 仅有 line 类型的图表,可以是尖角或曲线。这是它在实际应用程序中,以货币汇率为例的展示效果
这是一个 Swift 包,所以您需要执行以下操作
- 在 Xcode 菜单中打开
File - 打开
Swift Packages - 选择
Add Package Dependency...选项 - 在
Enter package repository URL字段中粘贴此 URL:https://github.com/pichukov/LightChart - 选择任何现有版本或
master分支选项
添加 import LightChart 并将 LightChartView 添加到您的 SwiftUI 代码中
LightChartView(data: [4, 8, 12, 10, 25])
默认情况下,它将绘制一个红色折线图
要自定义它,您可以使用几个属性
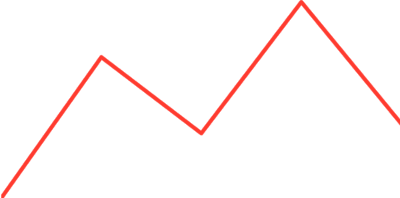
图表的类型,它是一个包含两种情况的 enum (枚举)
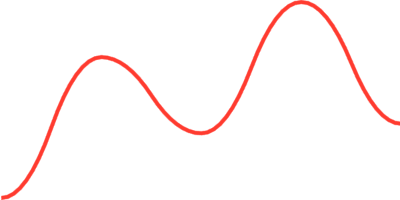
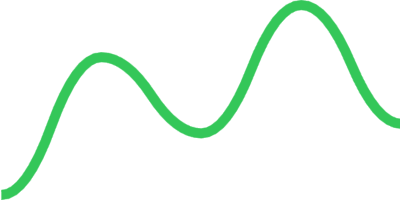
.line是默认类型,将绘制上面展示的图表.curved将绘制一个曲线图,例如
LightChartView(data: [2, 17, 9, 23, 10], type: .curved)
图表的视觉部分。一个包含三种情况的 enum (枚举)
.outline(color: Color, lineWidth: CGFloat)用于指定stroke(描边) 的color(颜色) 和lineWidth(线宽)
LightChartView(data: [2, 17, 9, 23, 10],
               type: .curved,
               visualType: .outline(color: .green, lineWidth: 5))
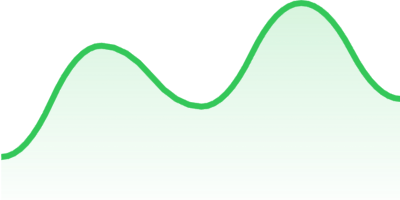
.filled(color: Color, lineWidth: CGFloat)使用描边颜色以渐变填充图表
LightChartView(data: [2, 17, 9, 23, 10],
               type: .curved,
               visualType: .filled(color: .green, lineWidth: 5))

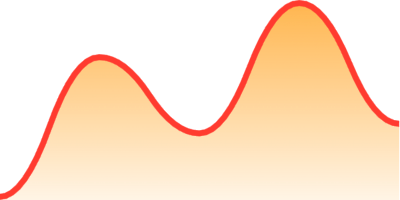
.customFilled(color: Color, lineWidth: CGFloat, fillGradient: LinearGradient)还提供了更改填充渐变 (fillGradient) 的选项
LightChartView(data: [2, 17, 9, 23, 10],
               type: .curved,
               visualType: .customFilled(color: .red,
                                         lineWidth: 3,
                                         fillGradient: LinearGradient(
                                                    gradient: .init(colors: [Color.orange.opacity(0.7), Color.orange.opacity(0.1)]),
                                                    startPoint: .init(x: 0.5, y: 1),
                                                    endPoint: .init(x: 0.5, y: 0)
                                                 )))
默认情况下,offset (偏移量) 为 0,这意味着图表占据父视图的整个区域。您可以通过更改 offset 值来向上移动图表线。例如,如果您使用 offset: 0.2,您的图表线将向上移动,仅占据父视图的 80%
LightChartView(data: [2, 17, 9, 23, 10],
               type: .curved,
               visualType: .filled(color: .green, lineWidth: 3),
               offset: 0.2)
offset (偏移量) 仅影响图表线,而不影响填充渐变
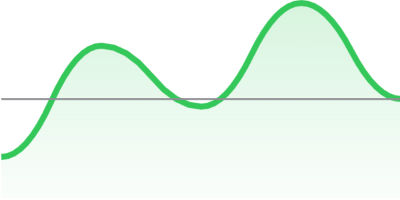
可以选择添加一条水平线来指示数据集的最后一个值。currentValueLineType (当前值线类型) 是一个包含三种情况的 enum (枚举)
.none是默认值,不显示任何线.line(color: Color, lineWidth: CGFloat)添加一条具有color(颜色) 和lineWidth(线宽) 的stroke(描边) 线
LightChartView(data: [2, 17, 9, 23, 10],
               type: .curved,
               visualType: .filled(color: .green, lineWidth: 3),
               offset: 0.2,
               currentValueLineType: .line(color: .gray, lineWidth: 1))
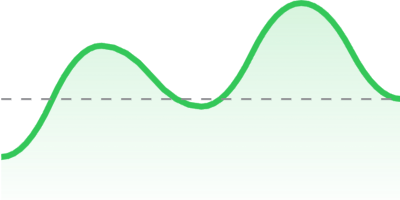
.dash(color: Color, lineWidth: CGFloat, dash: [CGFloat])添加一条虚线
LightChartView(data: [2, 17, 9, 23, 10],
               type: .curved,
               visualType: .filled(color: .green, lineWidth: 3),
               offset: 0.2,
               currentValueLineType: .dash(color: .gray, lineWidth: 1, dash: [5]))